


IoT | La station météo TensorFlow prévoit l'intensité des précipitations
Composants et fournitures
| × | 1 | ||||
 |
| × | 1 | |||
| × | 1 | ||||
 |
| × | 1 | |||
 |
| × | 1 | |||
 |
| × | 1 | |||
 |
| × | 2 |
Outils et machines nécessaires
 |
|
Applications et services en ligne
 |
| |||
 |
| |||
 |
|
À propos de ce projet
Surtout en 2020, des pluies abondantes et violentes instantanées ont eu des effets néfastes sur les serres et les rendements des cultures dans mon pays. Malheureusement, ces jours-ci, des précipitations inattendues et excessives se produisent plus fréquemment et sont devenues relativement courantes en raison du changement climatique dans certaines régions. Pendant ce temps, d'autres régions souffrent de la sécheresse. Alors que 2020 passe, plus de trente-cinq incidents qui ont causé la perte de récoltes et de bétail en raison de pluies abondantes et violentes sont enregistrés dans ma région. Pour contribuer à la solution pour éviter et éviter les problèmes provoqués par les précipitations excessives comme la perte de productivité agricole, j'ai envisagé ce projet comme point de départ.
Je me suis principalement concentré sur les effets des précipitations excessives sur l'agriculture dans ce projet. Cependant, des précipitations excessives peuvent entraîner de nombreux aléas, par exemple [1] :
- inondations, y compris risque pour la vie humaine,
- dommages aux bâtiments et aux infrastructures,
- perte de récoltes et de bétail,
- les glissements de terrain, qui peuvent menacer des vies humaines, perturber les transports et les communications.
Comme le montrent les dernières études, des précipitations excessives peuvent affecter la productivité des cultures de diverses manières, notamment des dommages physiques directs, une plantation et une récolte retardées, une croissance racinaire limitée, un manque d'oxygène et une perte de nutriments. Ainsi, trop de pluie peut être aussi dangereuse que la sécheresse pour l'agriculture :"Les données des trois dernières décennies suggèrent que des précipitations excessives peuvent affecter le rendement des cultures autant que la chaleur excessive et la sécheresse. Dans une nouvelle étude, une équipe interdisciplinaire du L'Université de l'Illinois a établi un lien entre les données d'assurance-récolte, le climat, le sol et le rendement du maïs de 1981 à 2016. L'étude a révélé que, pendant certaines années, des précipitations excessives ont réduit le rendement du maïs aux États-Unis de 34 % par rapport au rendement attendu. la sécheresse et la chaleur excessive ont causé une perte de rendement allant jusqu'à 37% au cours de certaines années [2]" .
Malheureusement, les systèmes d'alerte précoce ne suffisent pas à empêcher entièrement l'exacerbation des effets des précipitations excessives sur les produits et les processus agricoles sans données météorologiques locales adéquates et préliminaires pour chaque serre ou ferme. Par conséquent, dans l'espoir d'éviter les effets néfastes des précipitations excessives sur l'agriculture, j'ai décidé de créer ce projet en tant que station météorologique à distance économique pour collecter et interpréter les informations météorologiques locales afin de faire des prévisions plus précises sur l'intensité des précipitations.
Après avoir fait quelques recherches sur l'apprentissage en profondeur et les réseaux de neurones, j'ai décidé de construire un réseau de neurones artificiels (ANN) basé sur le modèle de classification pour interpréter les données météorologiques locales accumulées afin de prédire l'intensité des précipitations en fonction des classes données. Comme l'indique l'étude suivante, les chercheurs ont appliqué différents modèles et types de réseaux neuronaux pour prévoir non seulement les précipitations mais aussi les phénomènes météorologiques :Par exemple, des chercheurs en Thaïlande ont pu obtenir des prévisions très précises en utilisant des réseaux de neurones à anticipation pour prédire les quantités de précipitations quantitatives dans la plage d'anticipation de une à trois heures afin de prédire les dangers d'inondations possibles.Les réseaux de neurones ont également été utilisés pour prédire phénomènes météorologiques en plus des valeurs de prévision traditionnelles, telles que la probabilité/quantité de précipitations, la vitesse du vent, la pression barométrique, etc. Ils ont été utilisés avec beaucoup de succès pour prédire les tornades. De plus, des chercheurs australiens ont utilisé avec succès un réseau de neurones pour identifier le brouillard à diverses prévisions des plages allant de 3 heures à 18 heures autour de l'aéroport international de Canberra [3]."
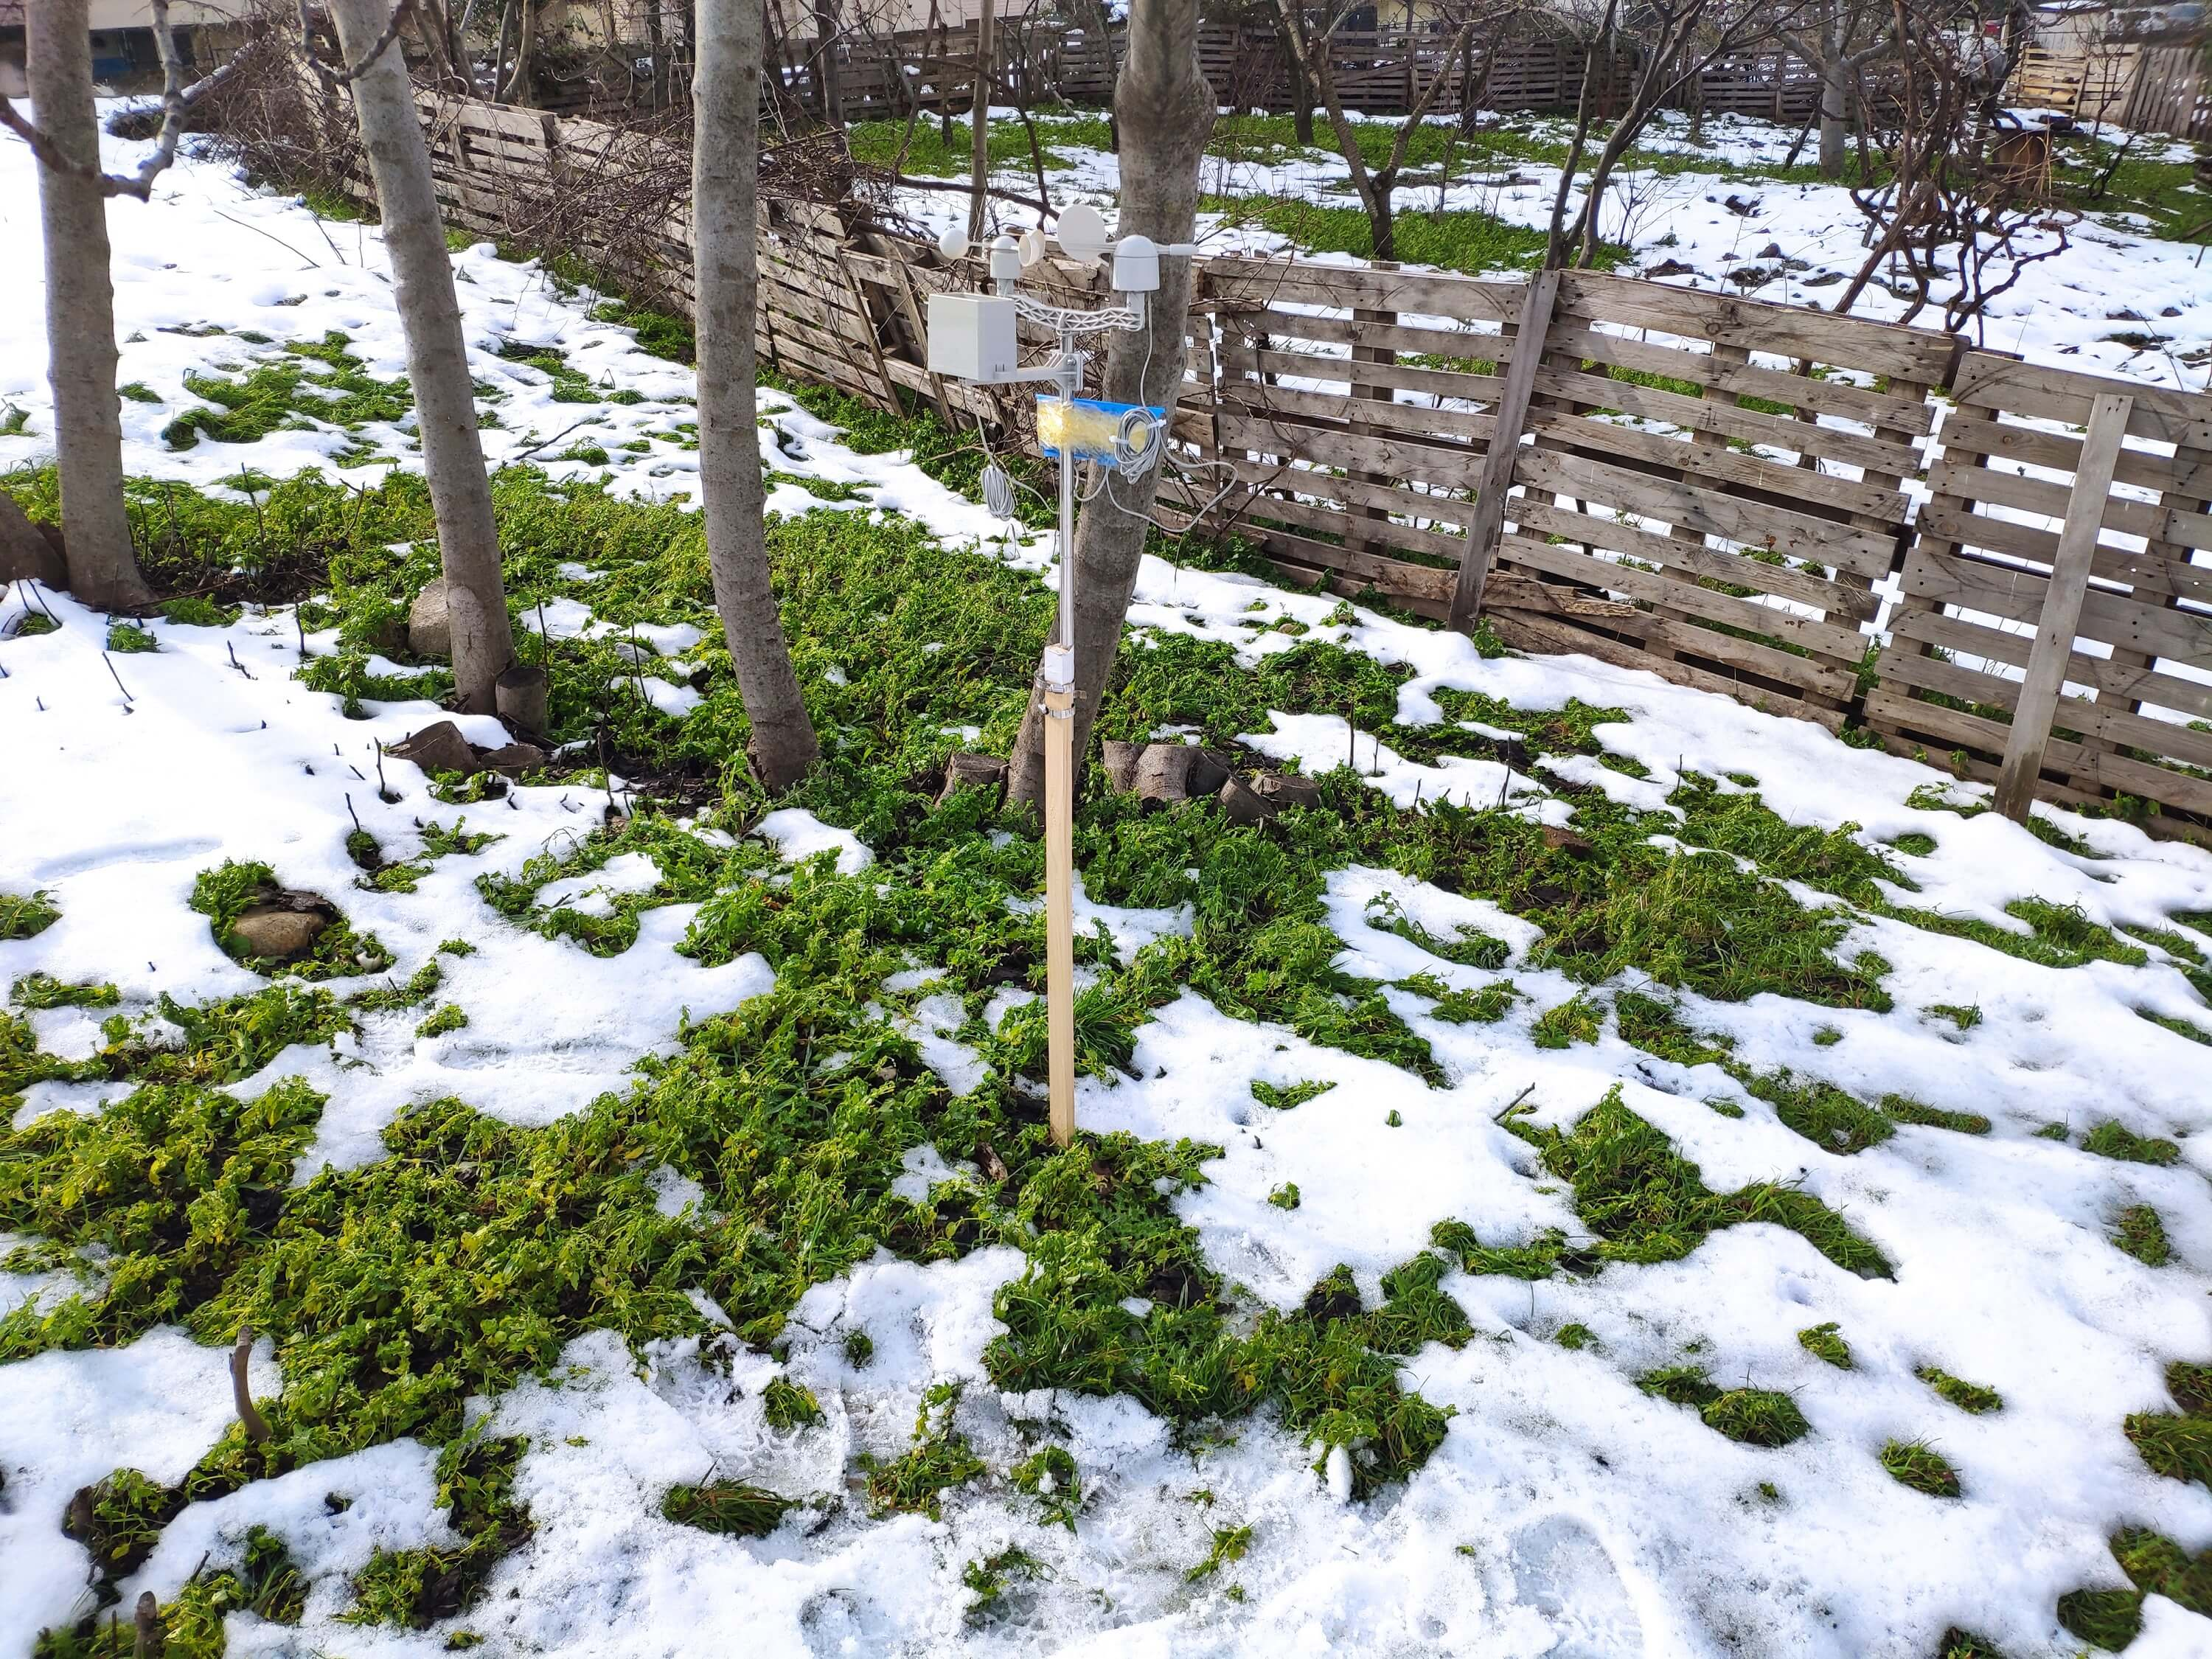
Avant de créer et de tester mon modèle de réseau neuronal, j'avais collecté des données météorologiques sur mon balcon et mon jardin dans un rayon de trois kilomètres pendant plus de trois mois pour créer un ensemble de données météorologiques locales affichant les informations météorologiques dans mon quartier. Pour pouvoir obtenir des informations météorologiques même dans des conditions météorologiques extrêmes, j'ai utilisé un kit de station météo avec anémomètre, girouette et seau de pluie de DFRobot avec deux cartes de développement différentes :
- NodeMCU ESP-12E (compatible Wi-Fi)
- Arduino Uno + DFRobot SIM808 Bouclier GPS/GPRS/GSM (compatible GPRS)
Ainsi, je pourrais transférer des données météo via WiFi sur mon balcon ou GPRS si la distance entre mon routeur et la station météo est trop éloignée.
J'ai décidé d'utiliser Google Sheets, un tableur basé sur le cloud, pour rassembler les données météorologiques générées par la station météo, car la création de grands ensembles de données et l'ajout de nouvelles informations sont simples avec l'API Google Sheets. Par conséquent, j'ai développé une application Web en PHP pour obtenir les données météorologiques transférées par les cartes de développement et les ajouter à une feuille de calcul sur Google Sheets.
Après avoir collecté des données météorologiques pendant plus de trois mois toutes les cinq minutes, j'ai construit un modèle de réseau de neurones artificiels (ANN) avec TensorFlow pour faire des prédictions sur l'intensité des précipitations. Théoriquement, j'ai attribué une classe d'intensité des précipitations pour chaque lecture après avoir mis à l'échelle et normalisé l'ensemble de données. Ensuite, j'ai entraîné le modèle de réseau de neurones pour classer ces classes :
- Aucune pluie
- Pluie légère
- Pluie modérée
- Pluies abondantes
- Pluie violente
Voici donc mon projet en quelques mots 😃
Dans les étapes suivantes, vous pouvez trouver des informations plus détaillées sur le codage, la collecte de données météorologiques locales et la création d'un modèle de réseau de neurones artificiels (ANN) avec TensorFlow.
Un grand merci à DFRobot pour le parrainage de ce projet.
Produits sponsorisés par DFRobot :
⭐ Kit station météo avec anémomètre/girouette/seau de pluie | Inspecter
⭐ Bouclier GPS/GPRS/GSM SIM808 pour Arduino | Inspecter
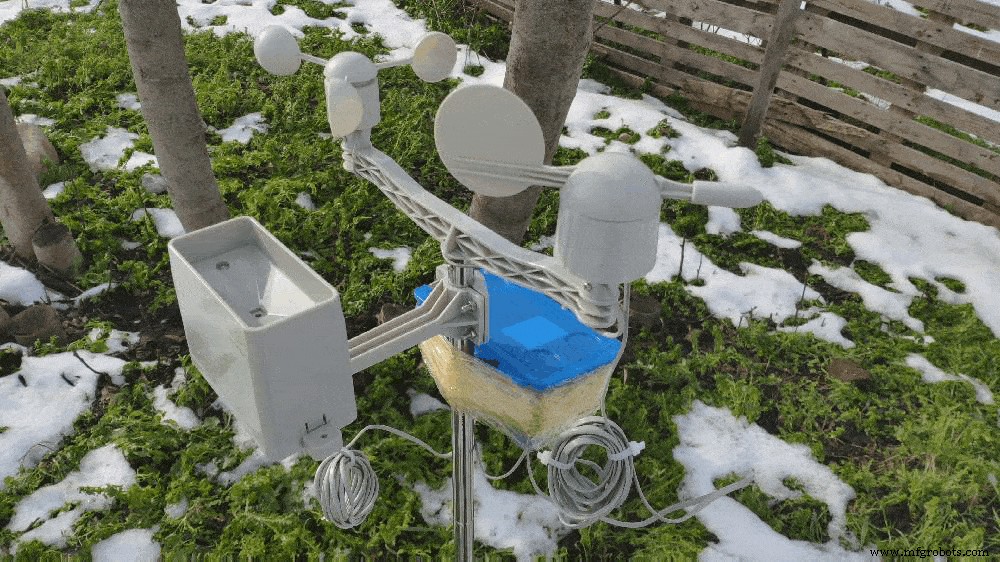
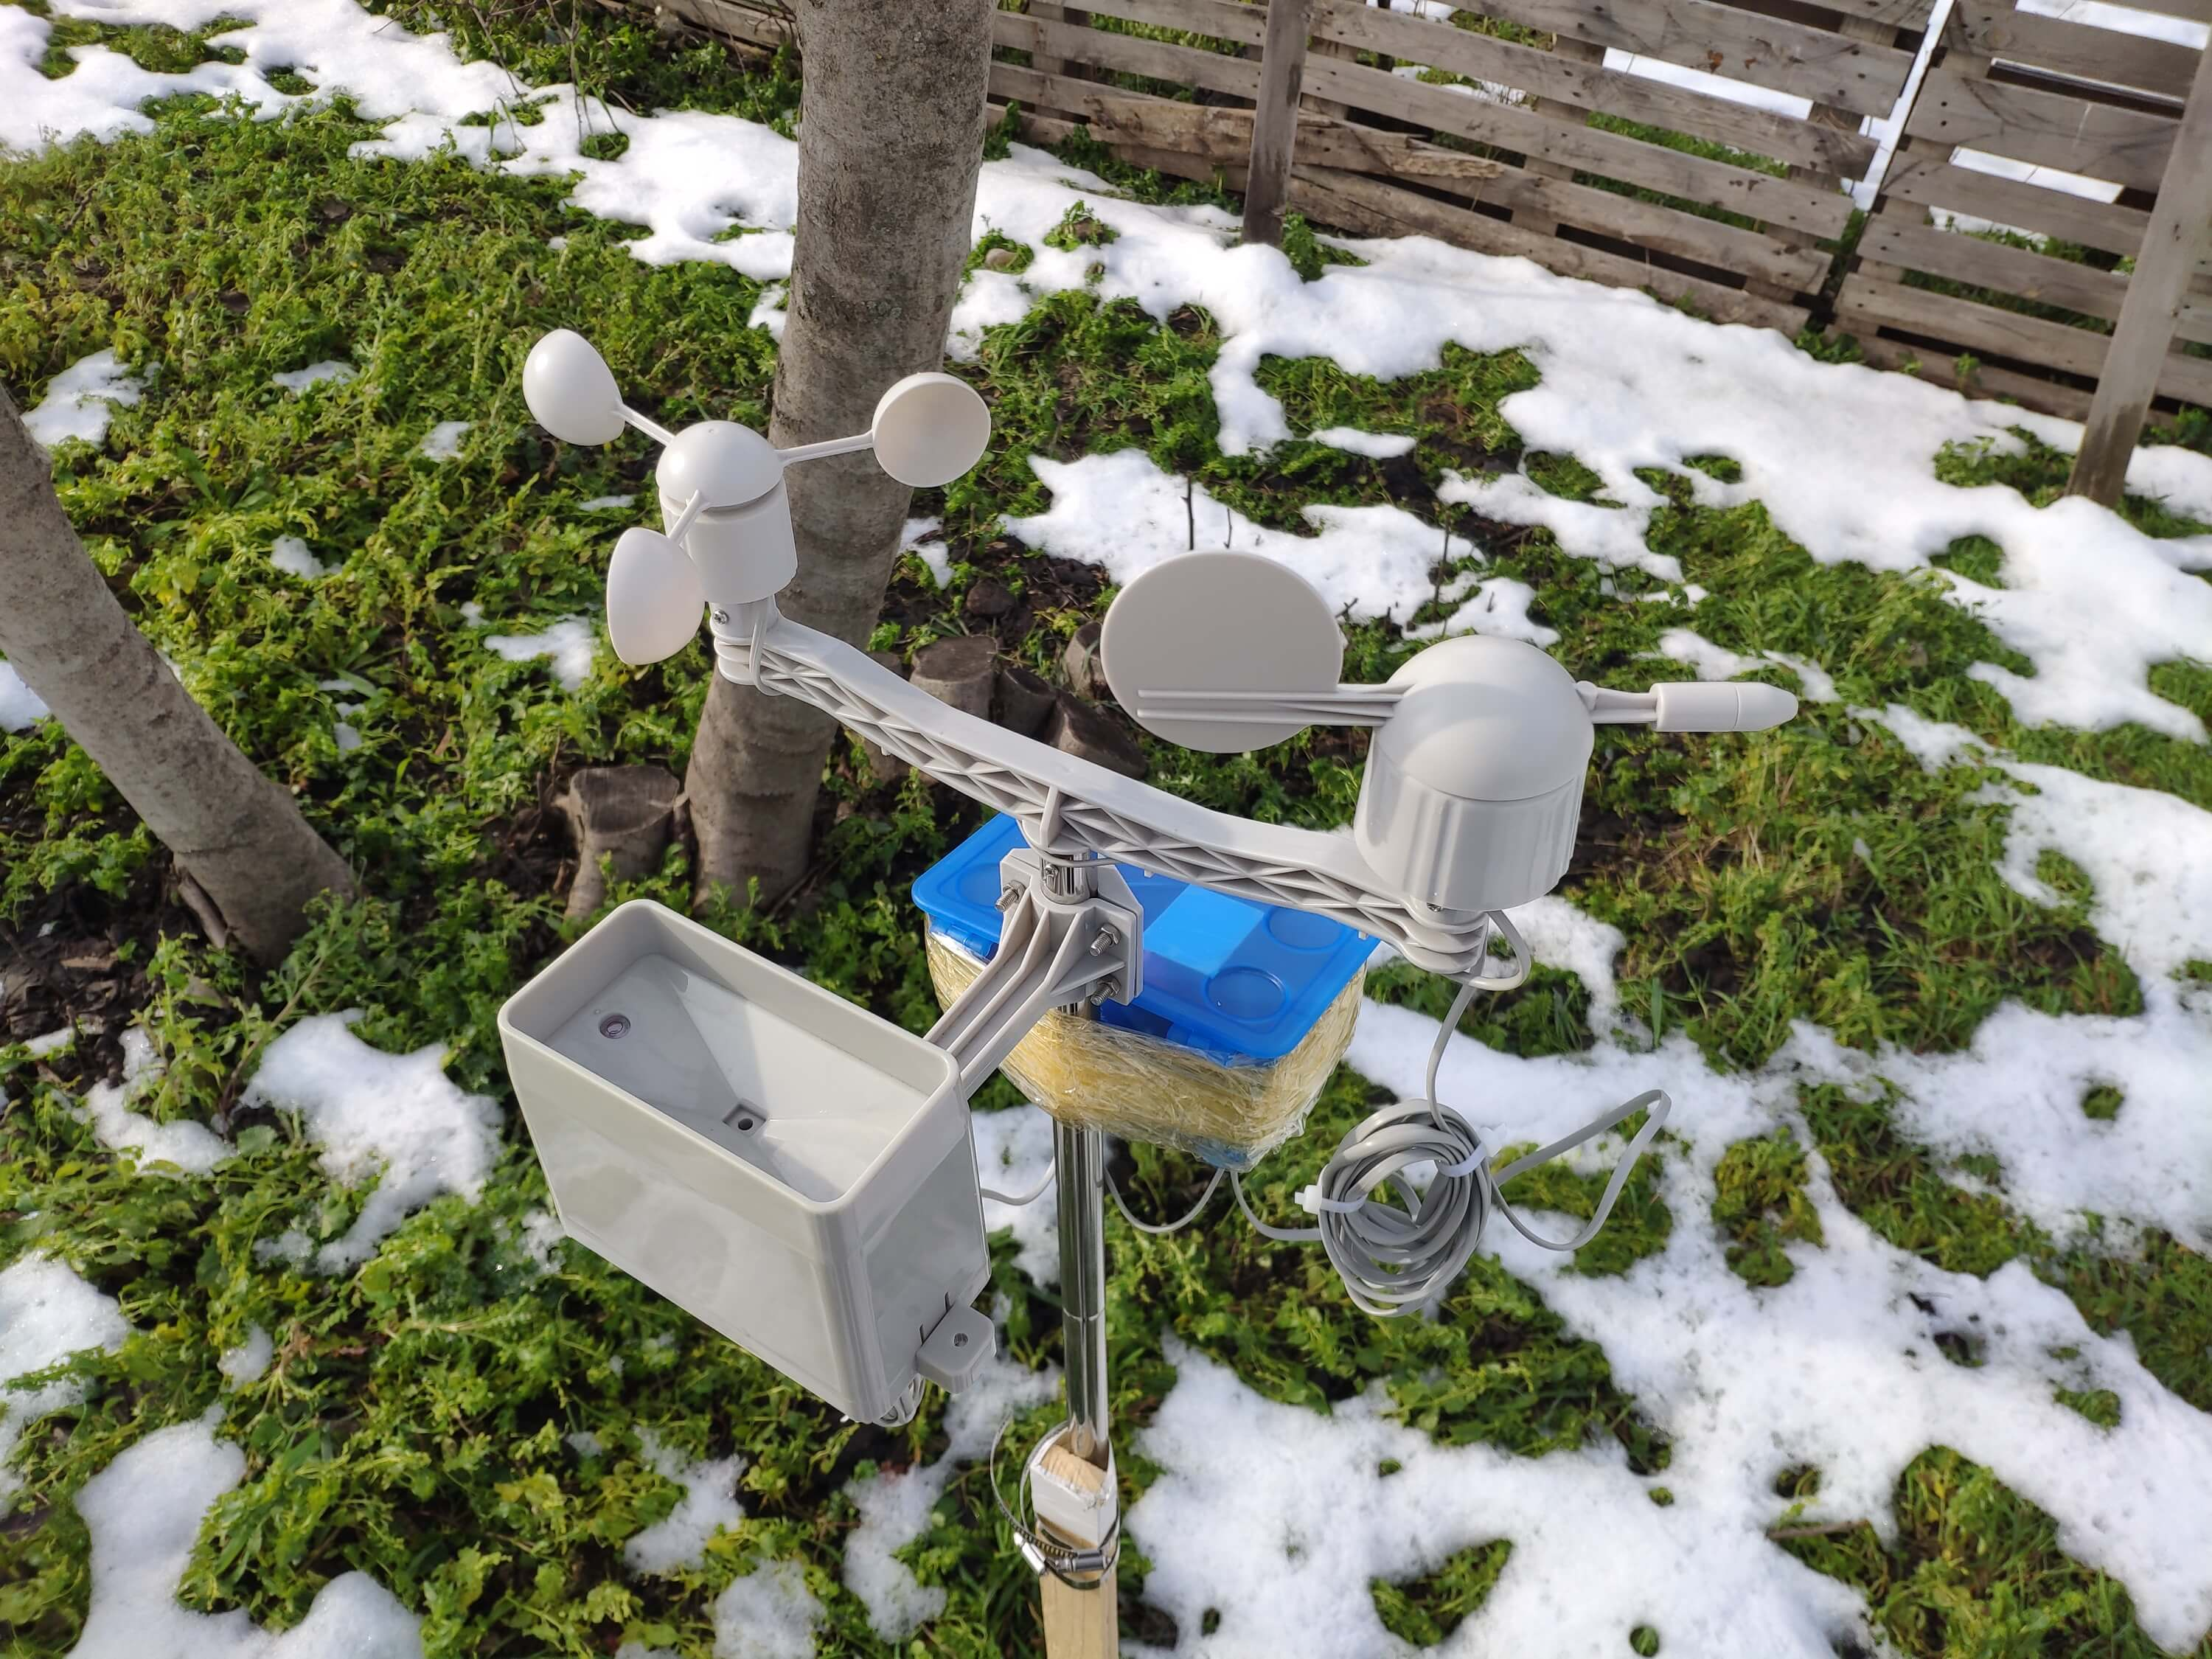
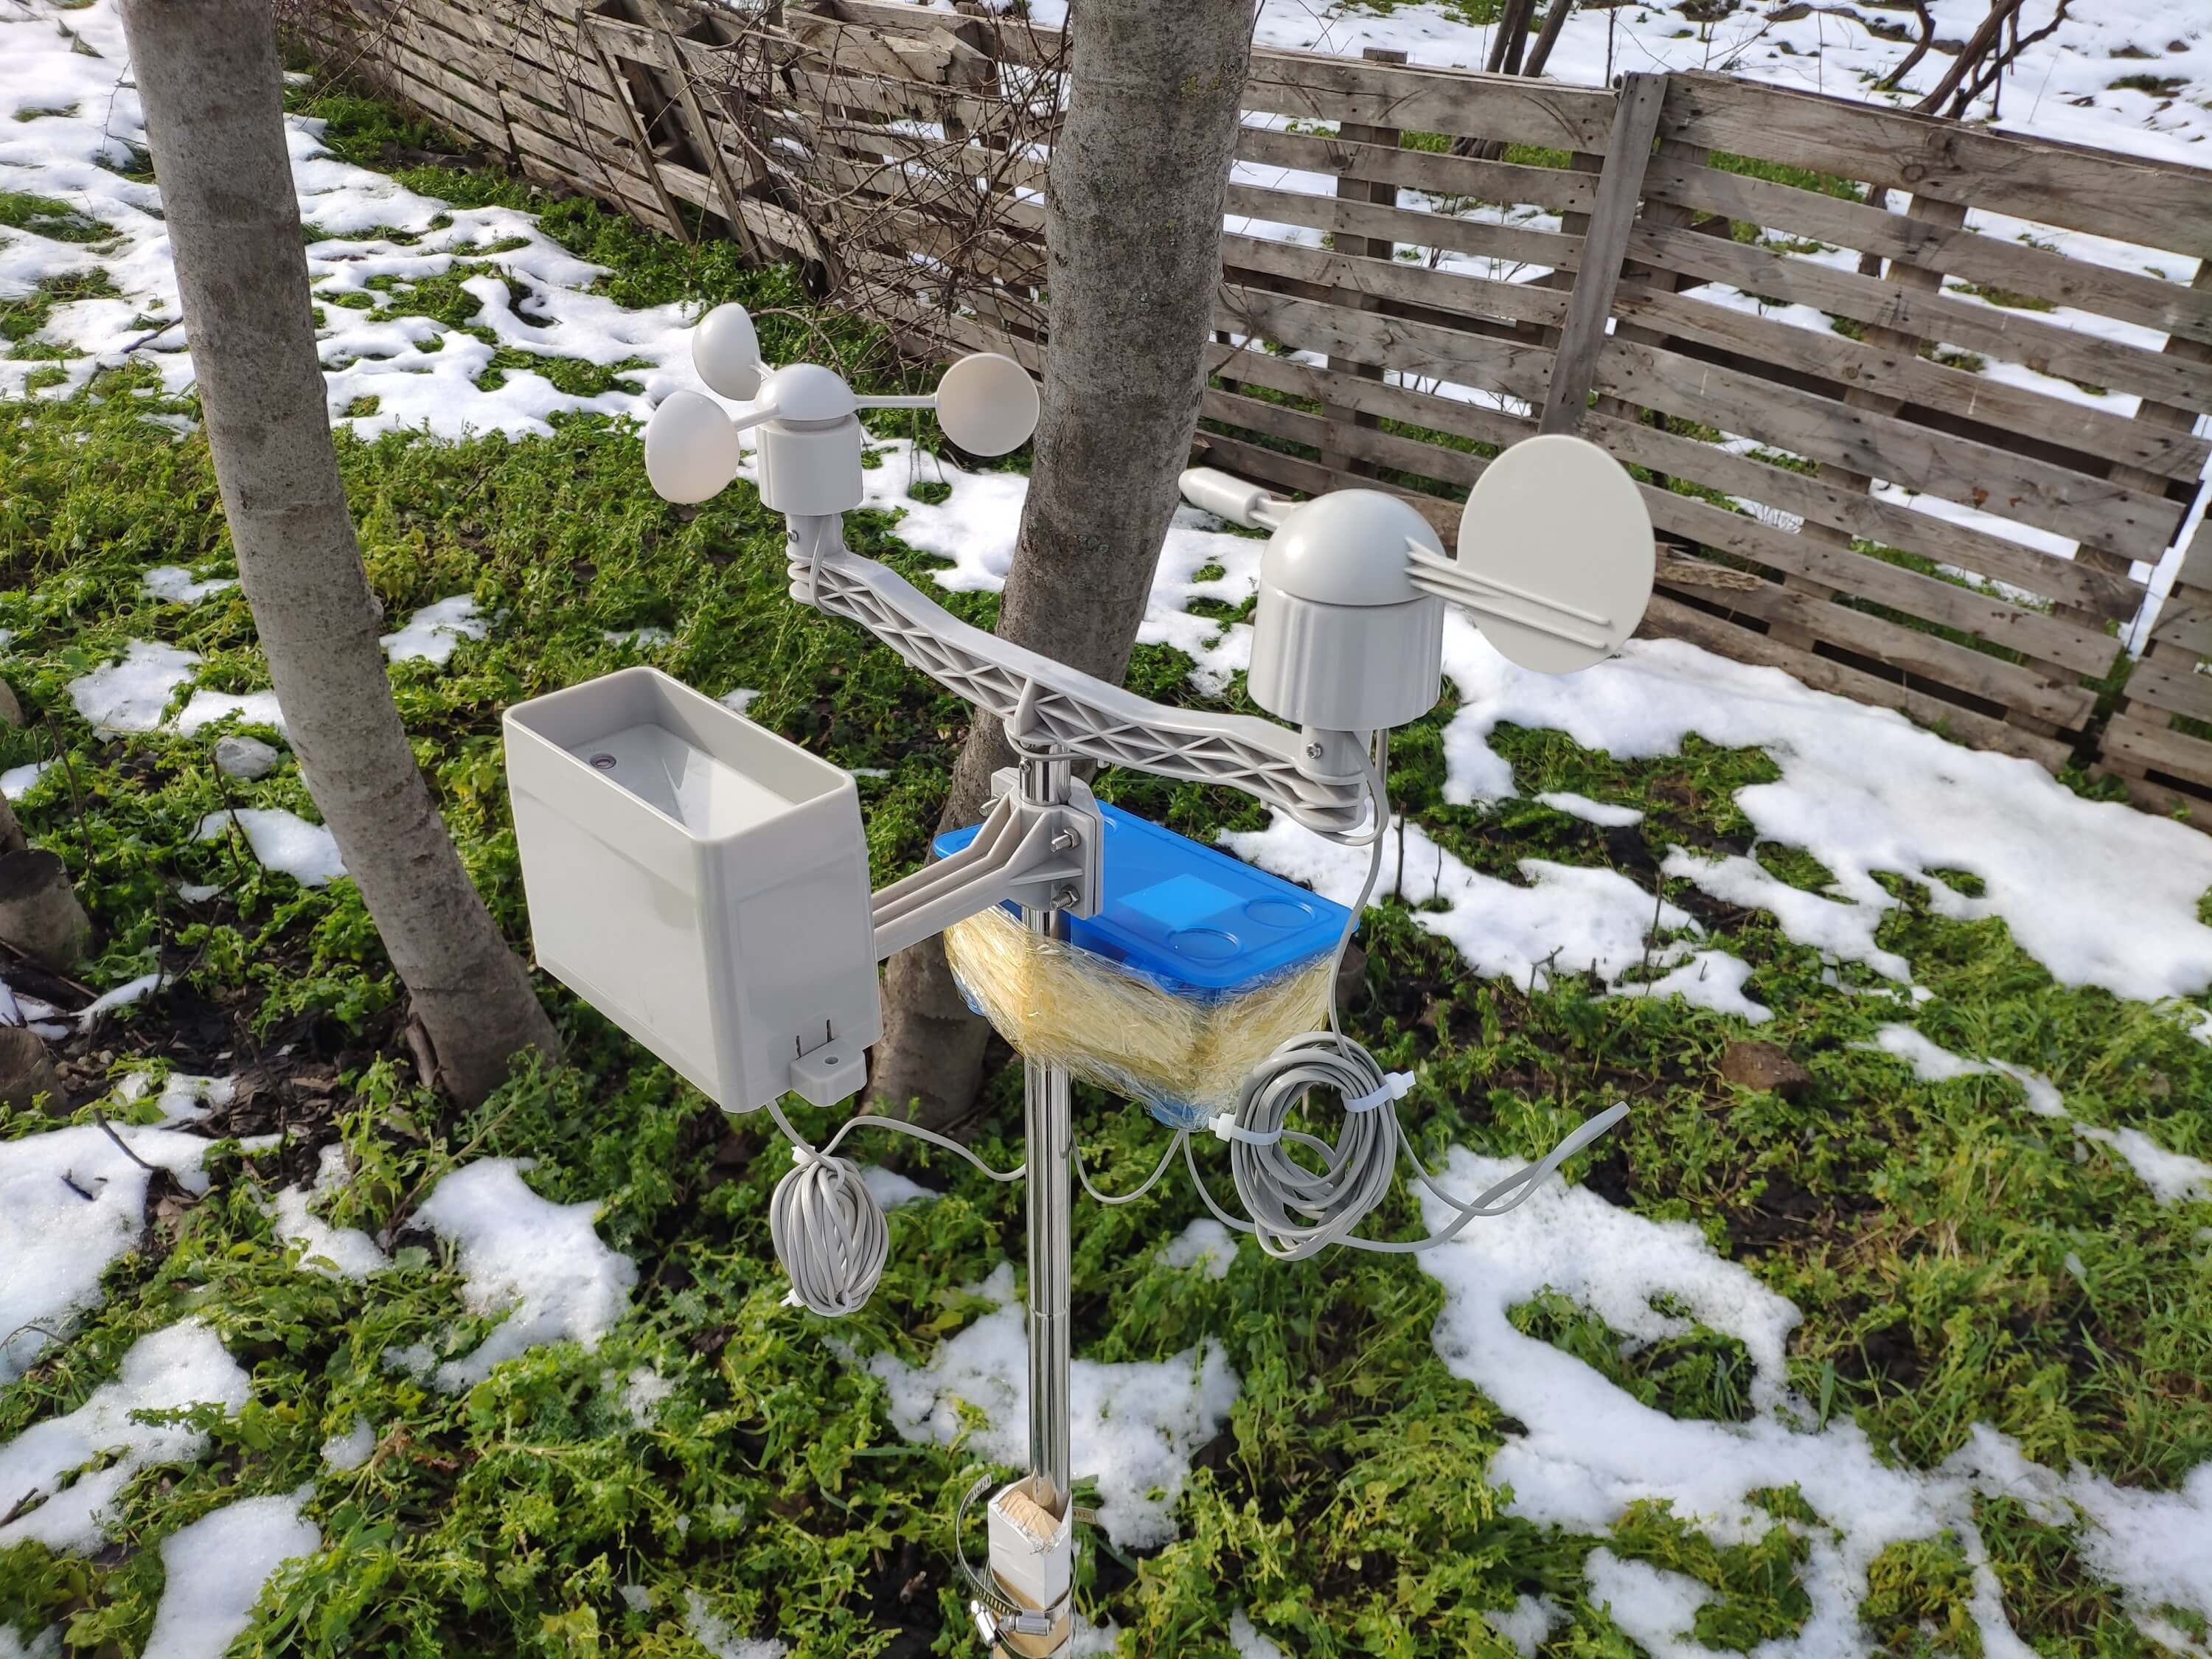
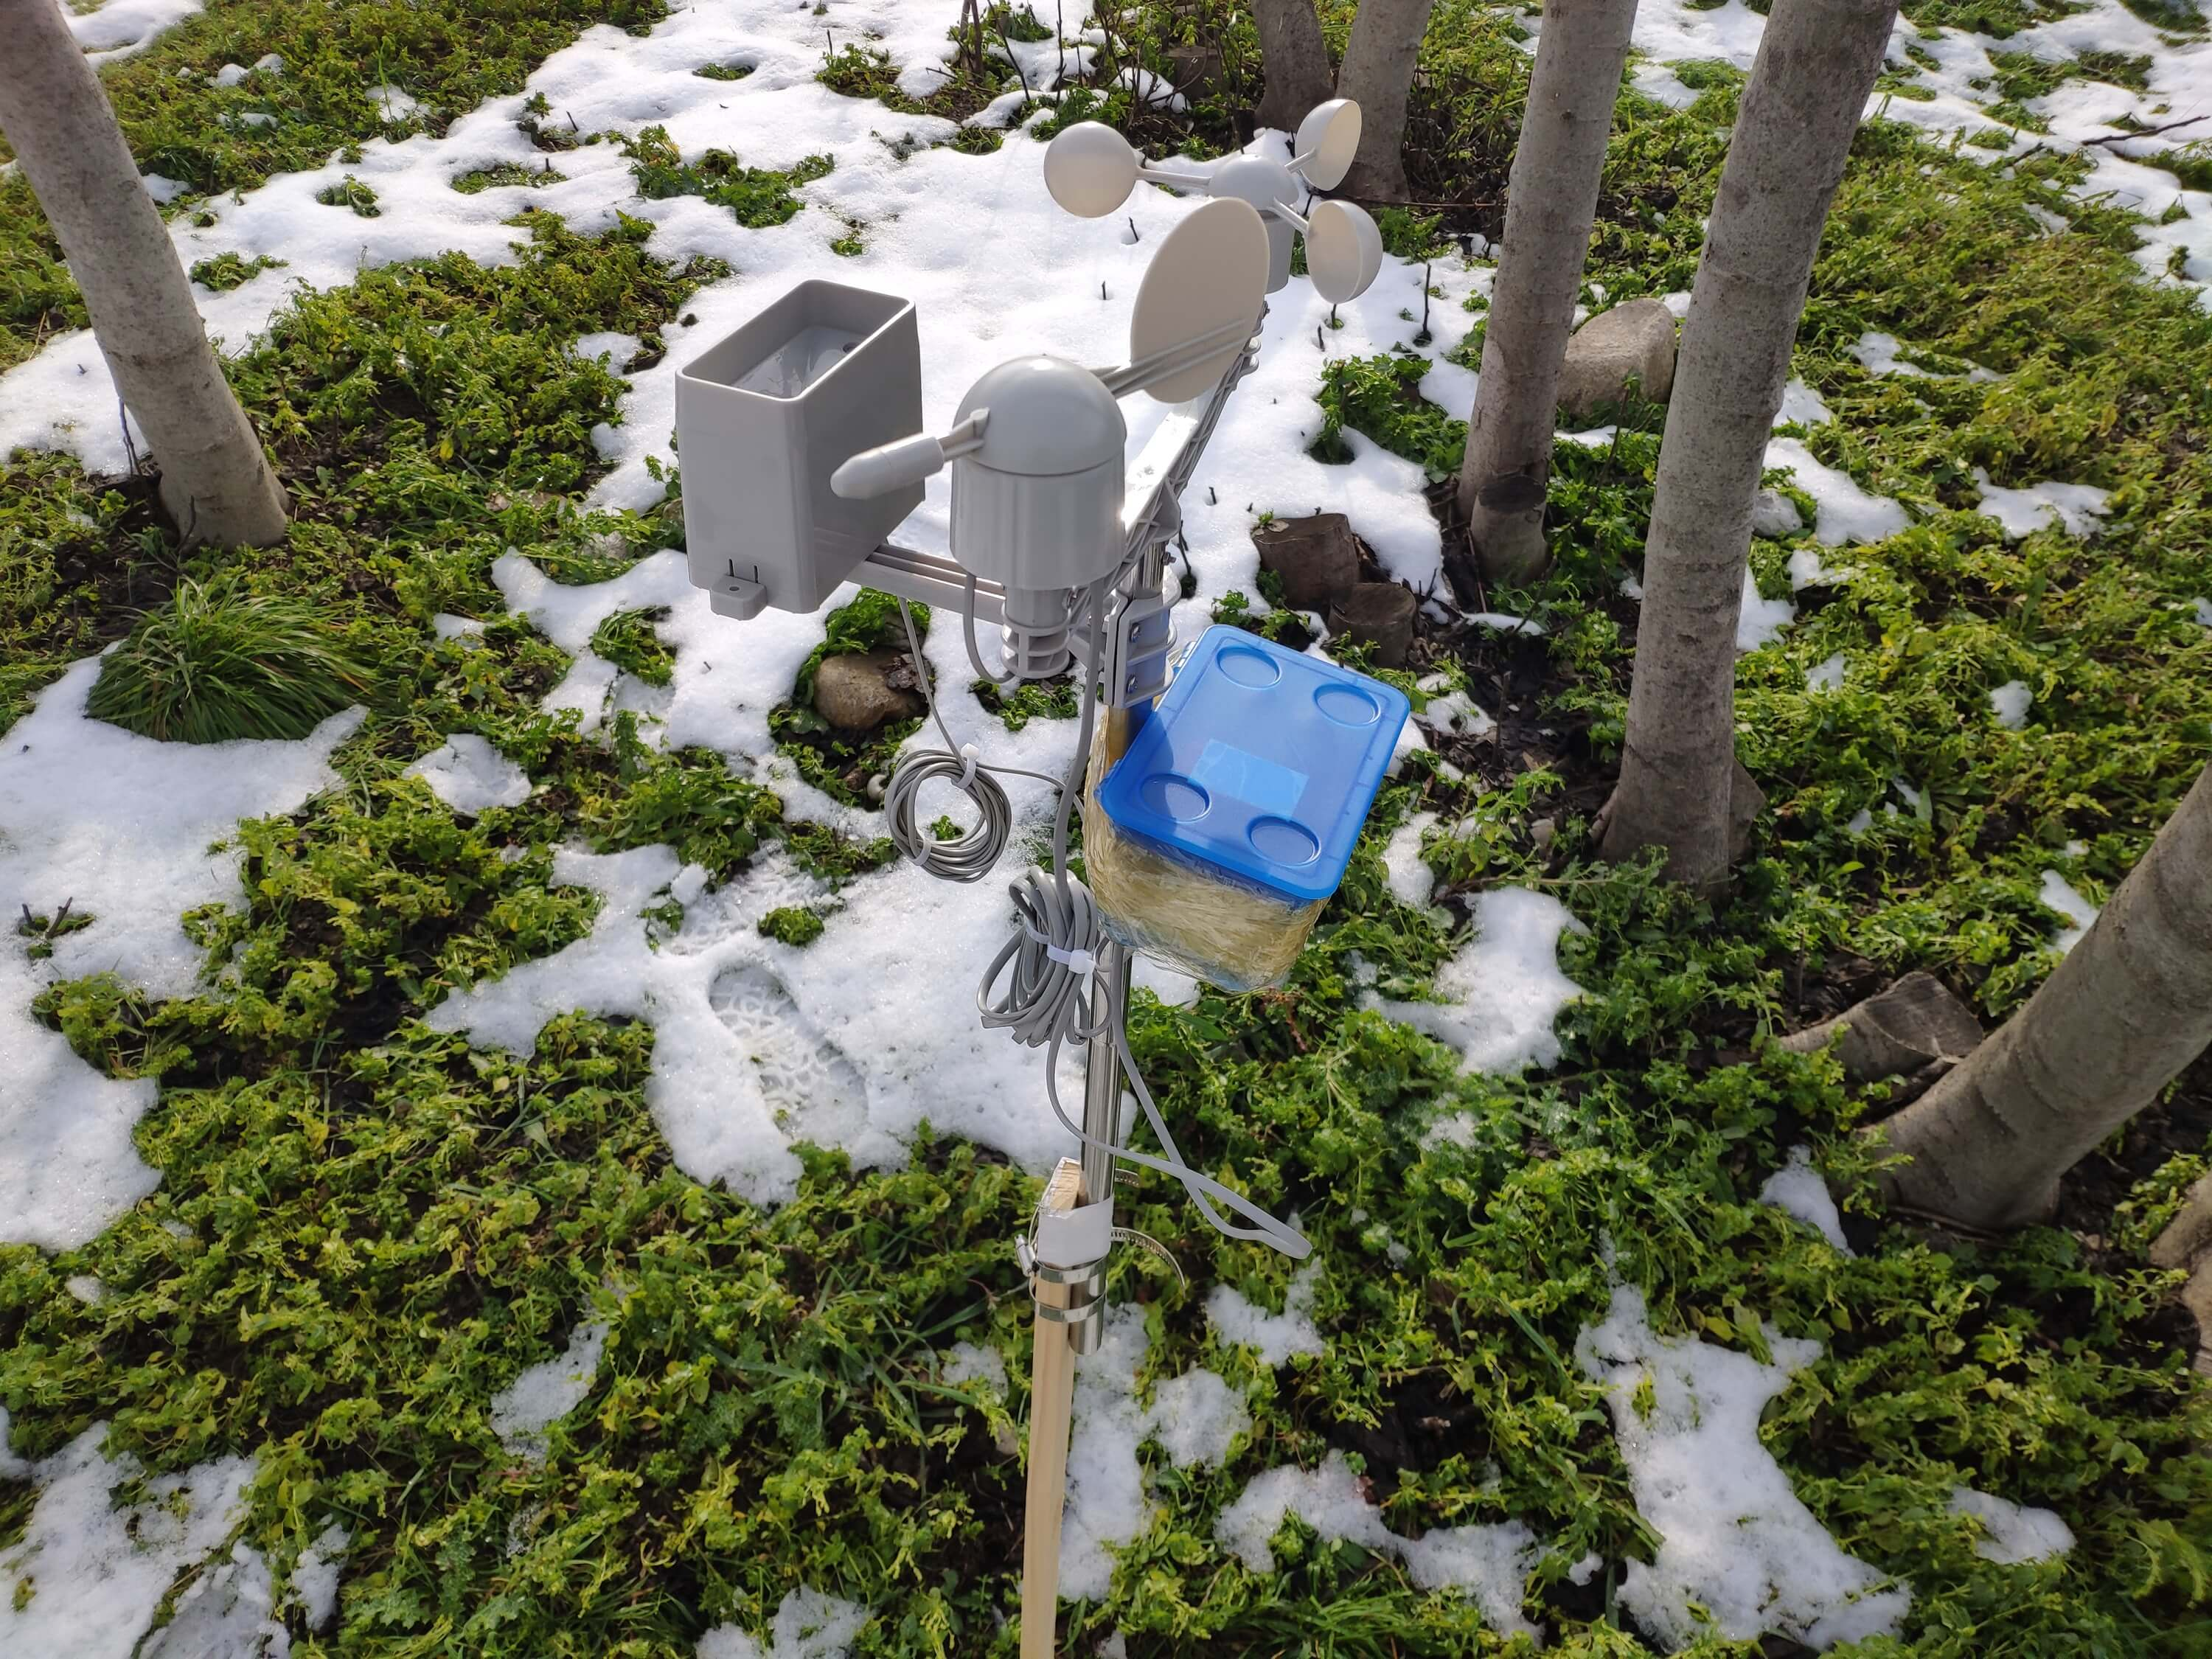
Étape 1 :Assemblage du kit de la station météo avec un anémomètre, une girouette et un seau à pluie
Ce kit de station météo comprend un anémomètre, une vigne à vent, un seau à pluie et une carte de capteur pour envoyer des données météorologiques via le protocole de communication série. Ainsi, il est facile à utiliser avec les cartes de développement pour collecter des données météorologiques locales.
Il génère 37 octets par seconde, y compris la fin CR/LF .
c000s000g000t086r000p000h53b10020 Analyseur de données :
- c000 : direction de l'air, degré
- s000 : vitesse de l'air (moyenne), 0,1 miles par heure
- g000 : vitesse de l'air (max), 0,1 miles par heure
- t086 : température, Fahrenheit
- r000 : précipitations (1 heure), 0,01 pouces
- p000 : précipitations (24 heures), 0,01 pouces
- h53 humidité, % (00%=100)
- b10020 : atmosphère, 0,1 hPa
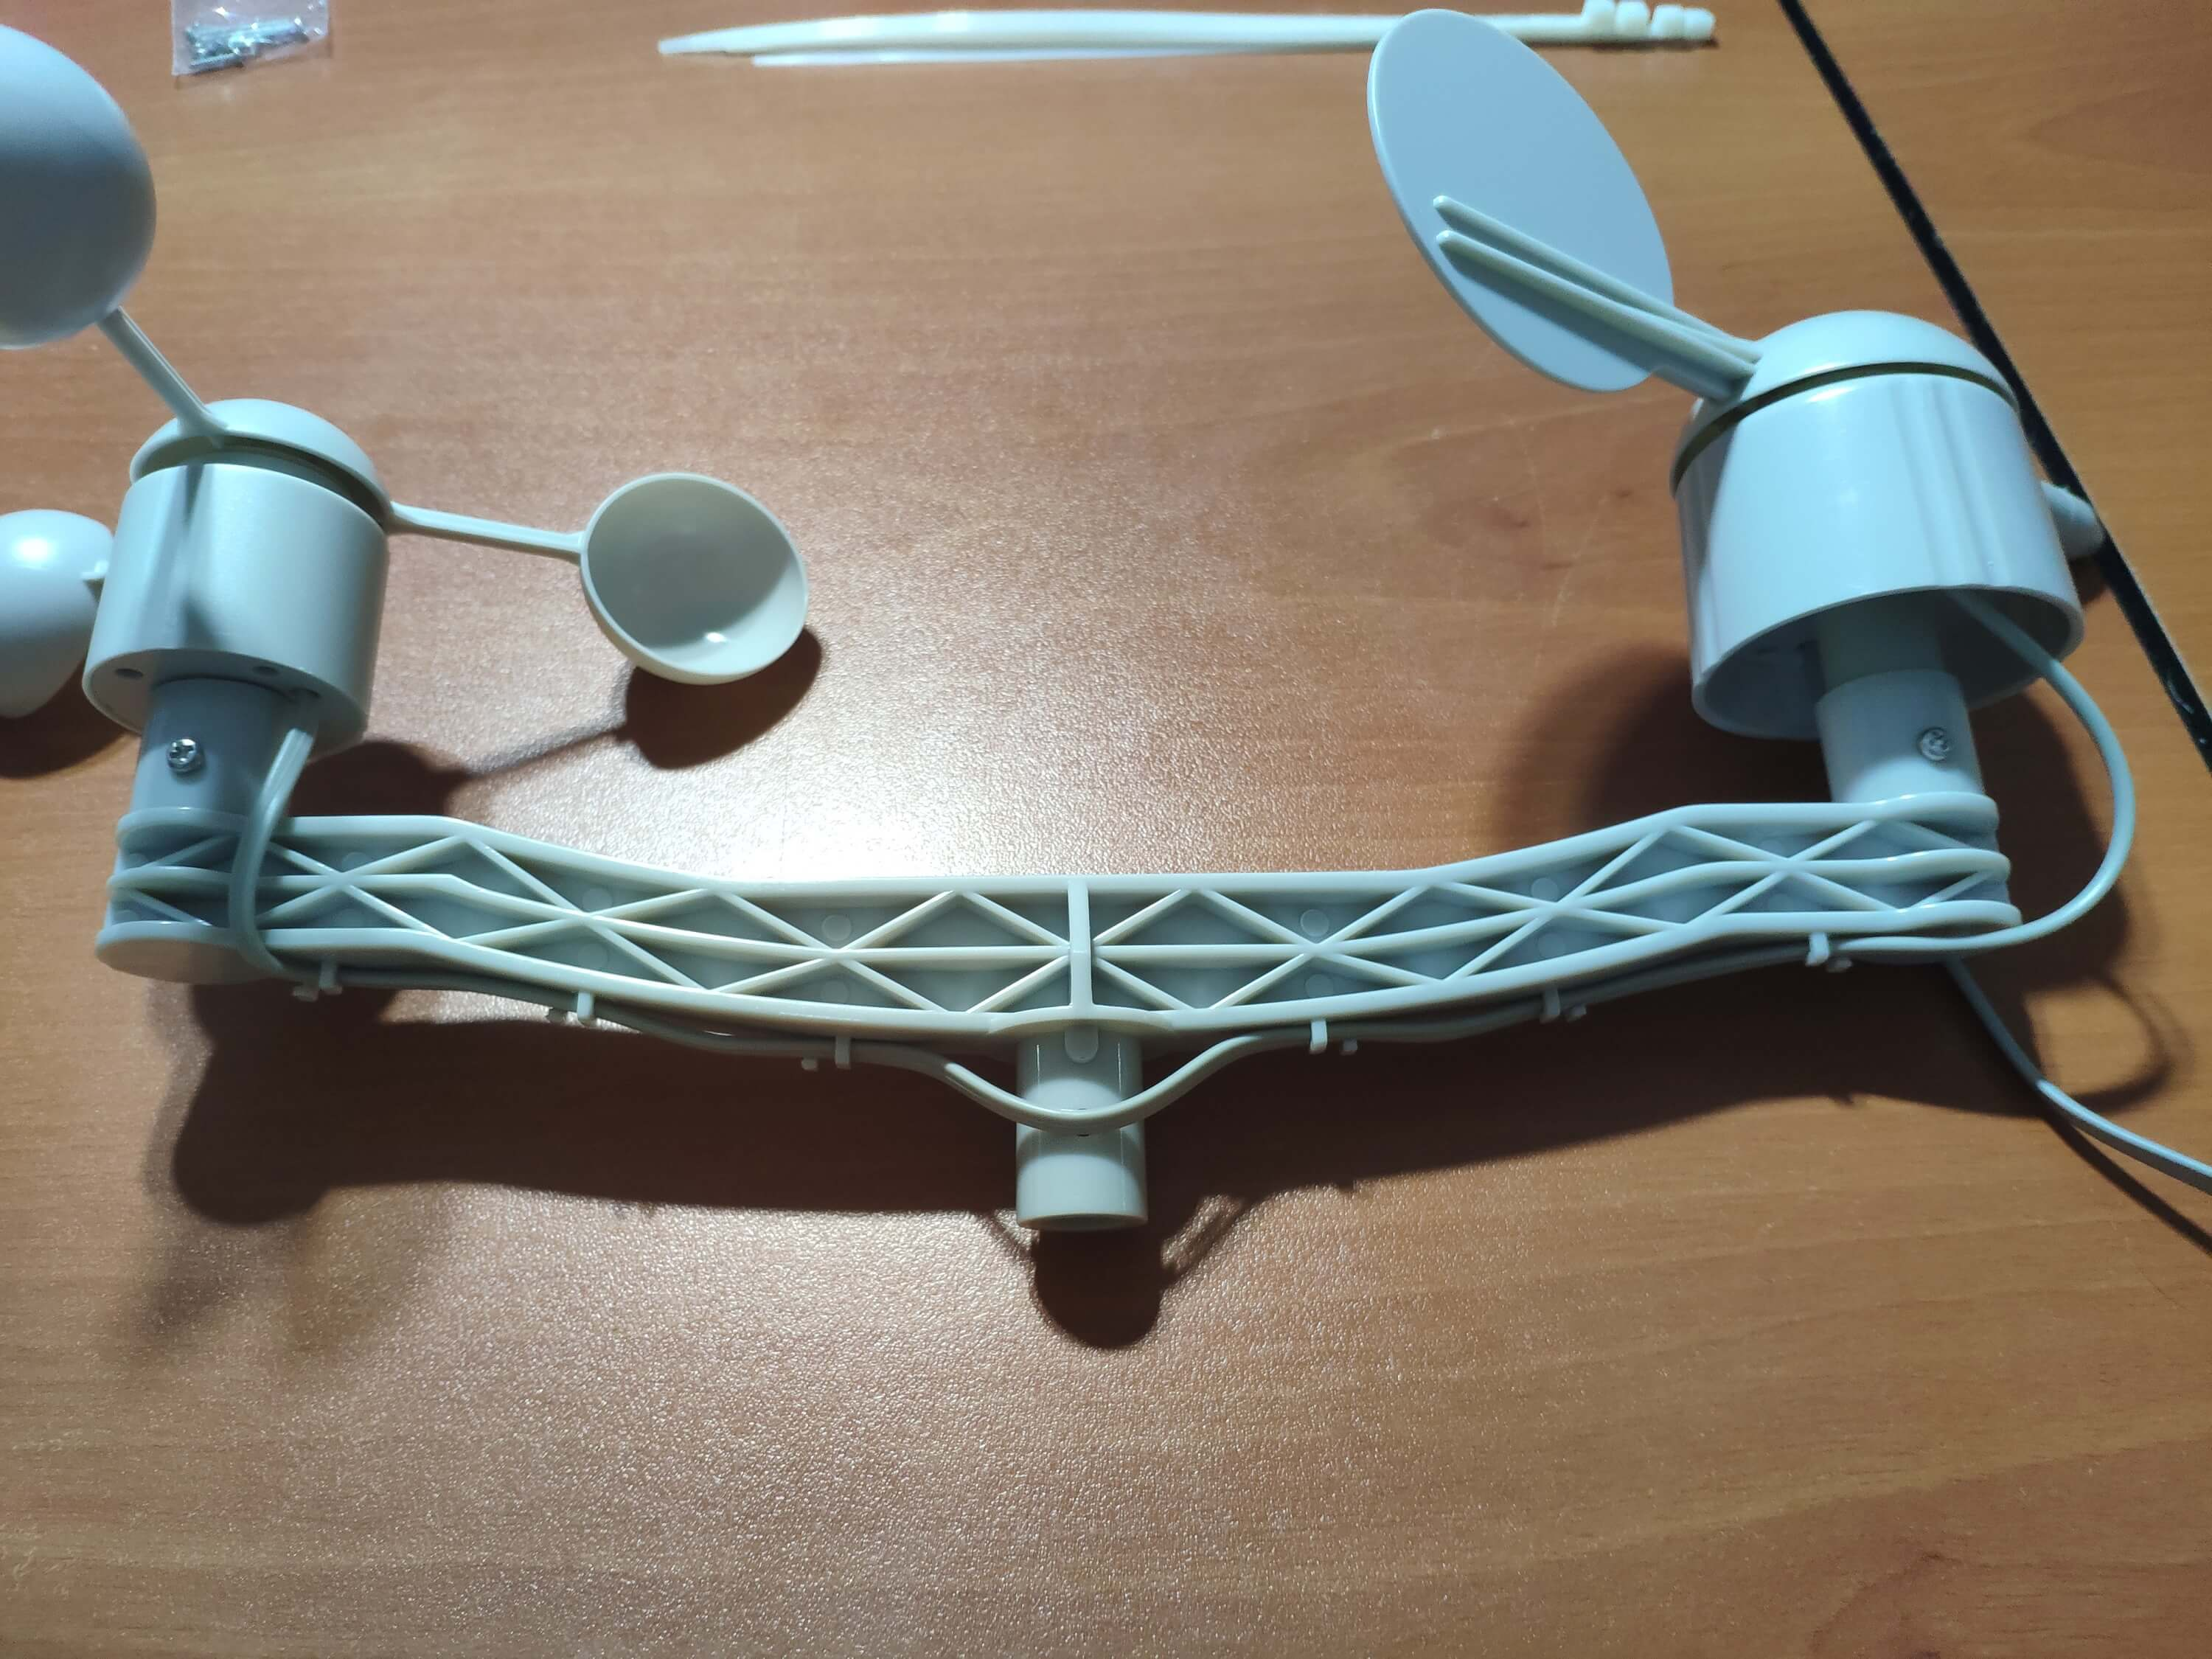
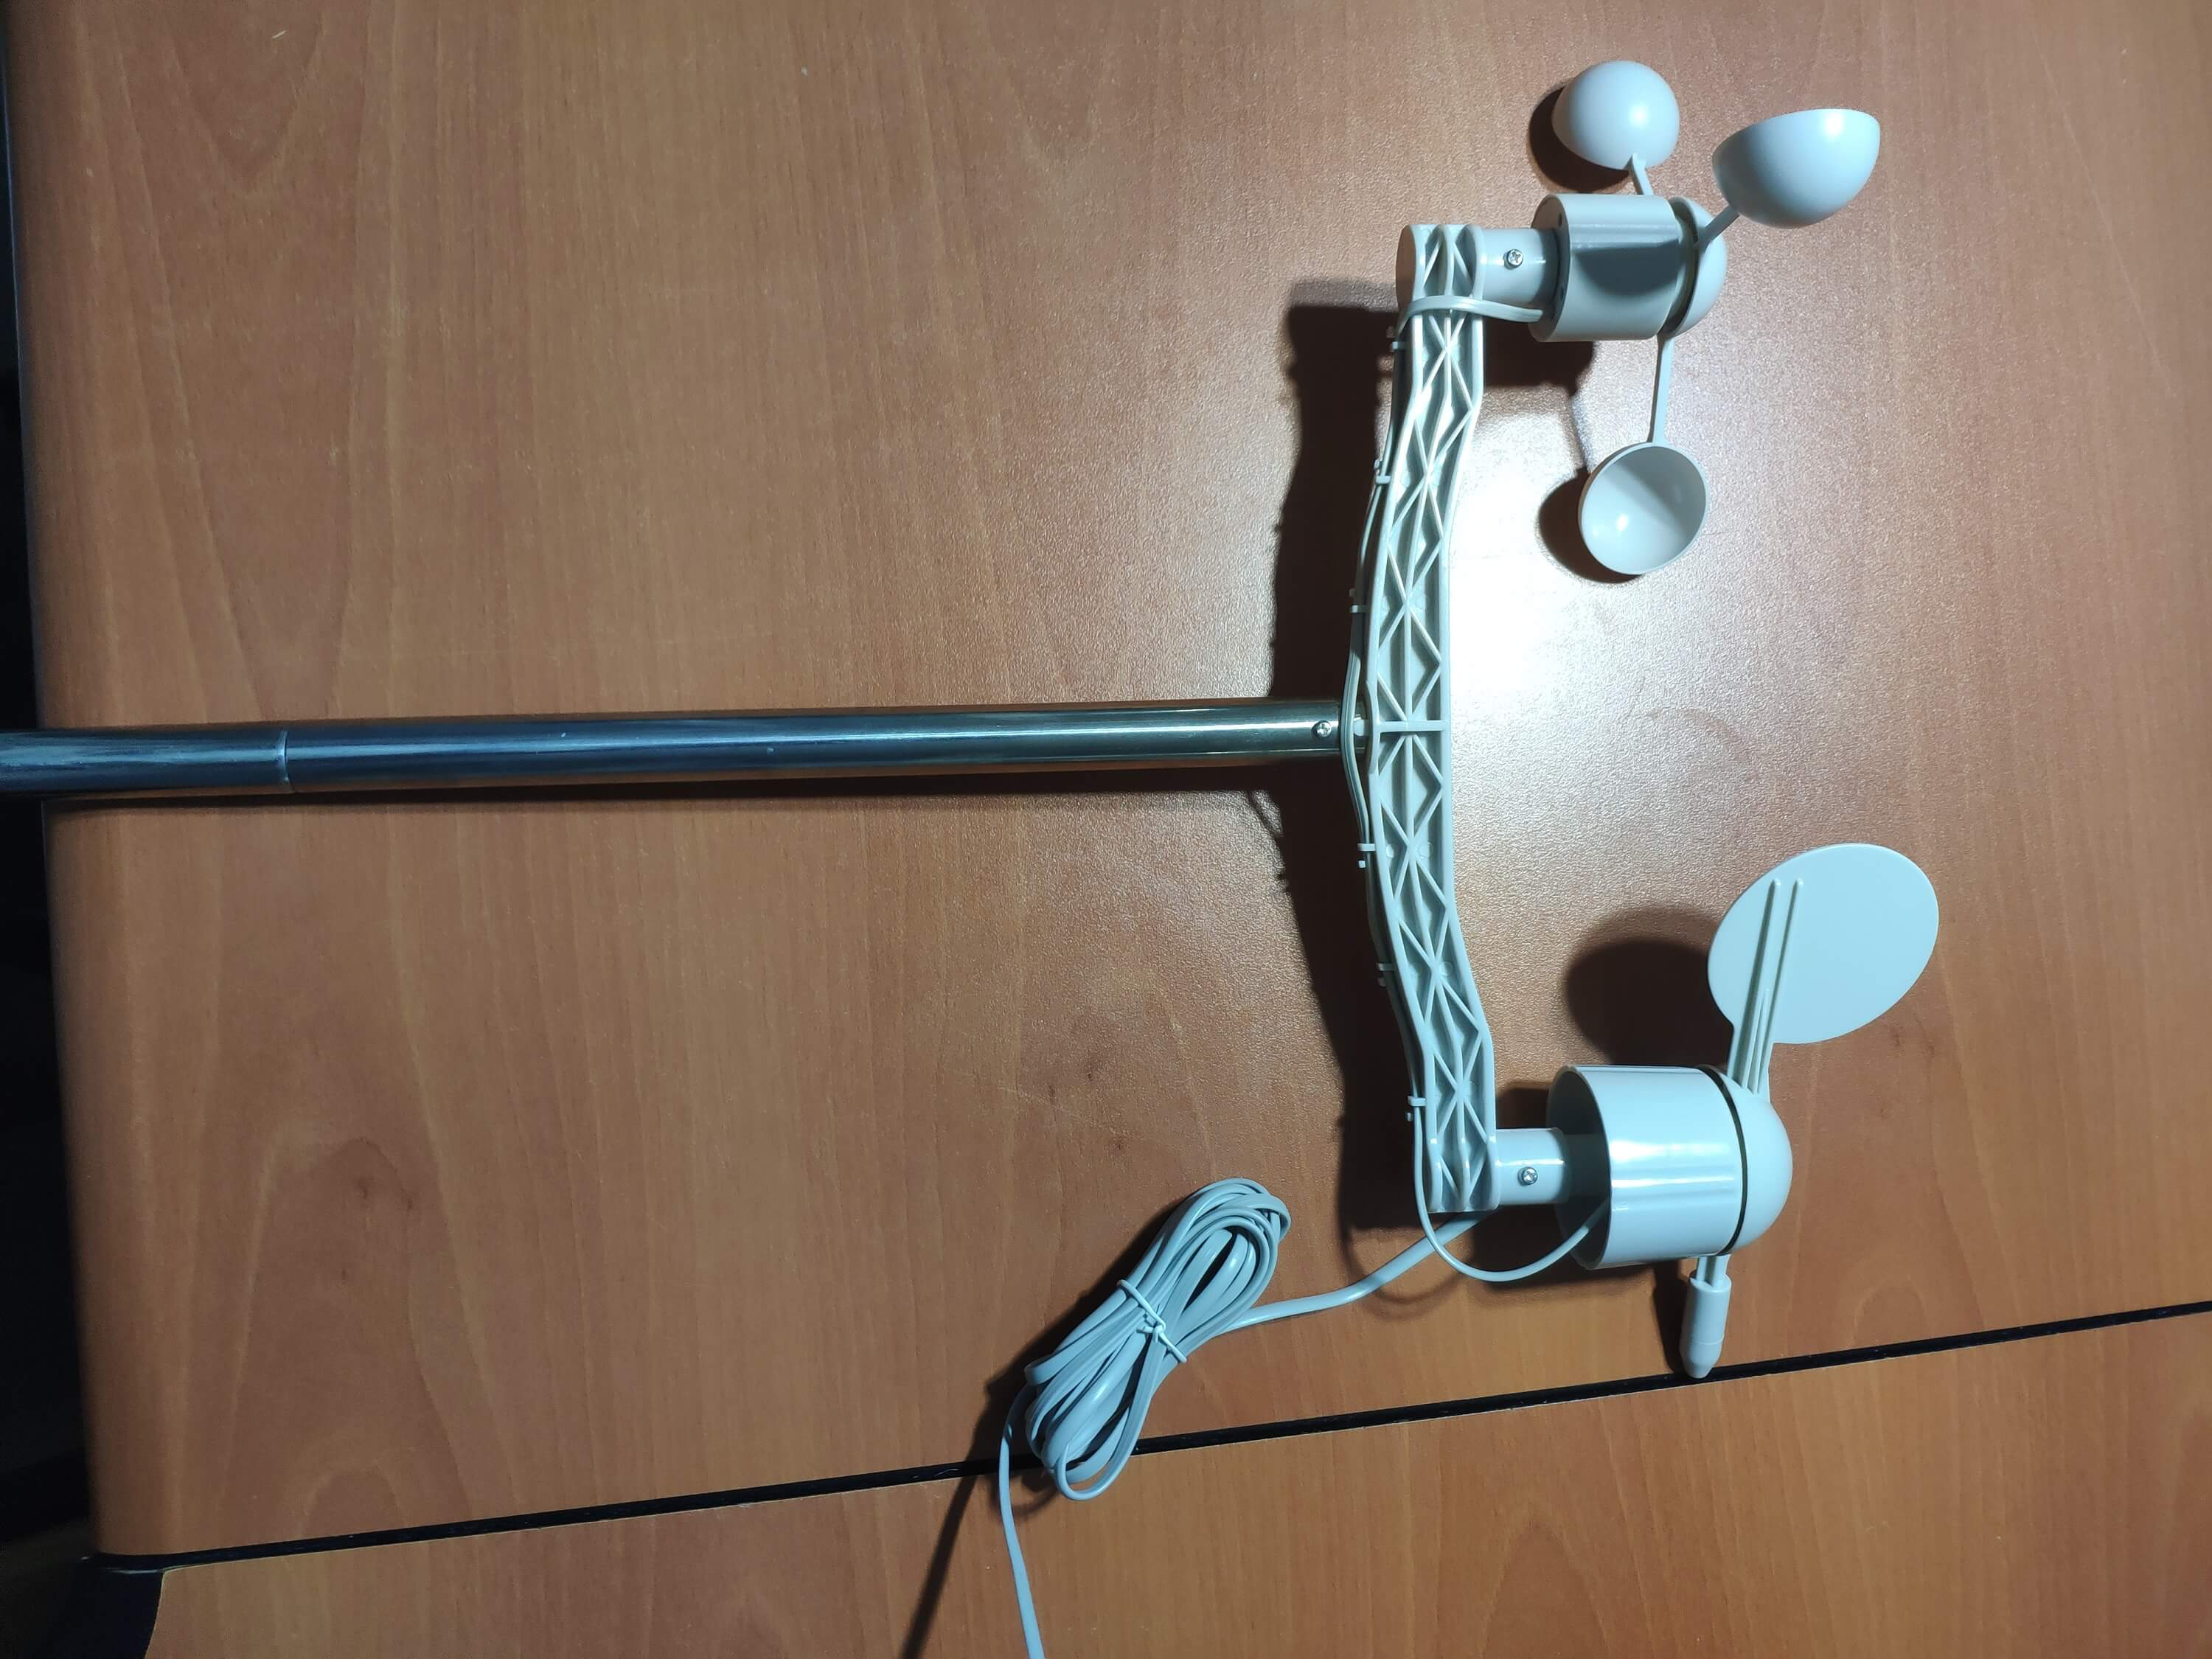
⭐ Fixez tout d'abord l'anémomètre et la girouette au pont à l'aide de vis et d'écrous.
⭐ Connectez la girouette à l'anémomètre à l'aide du cordon téléphonique RJ11 et serrez-le sous le pont.
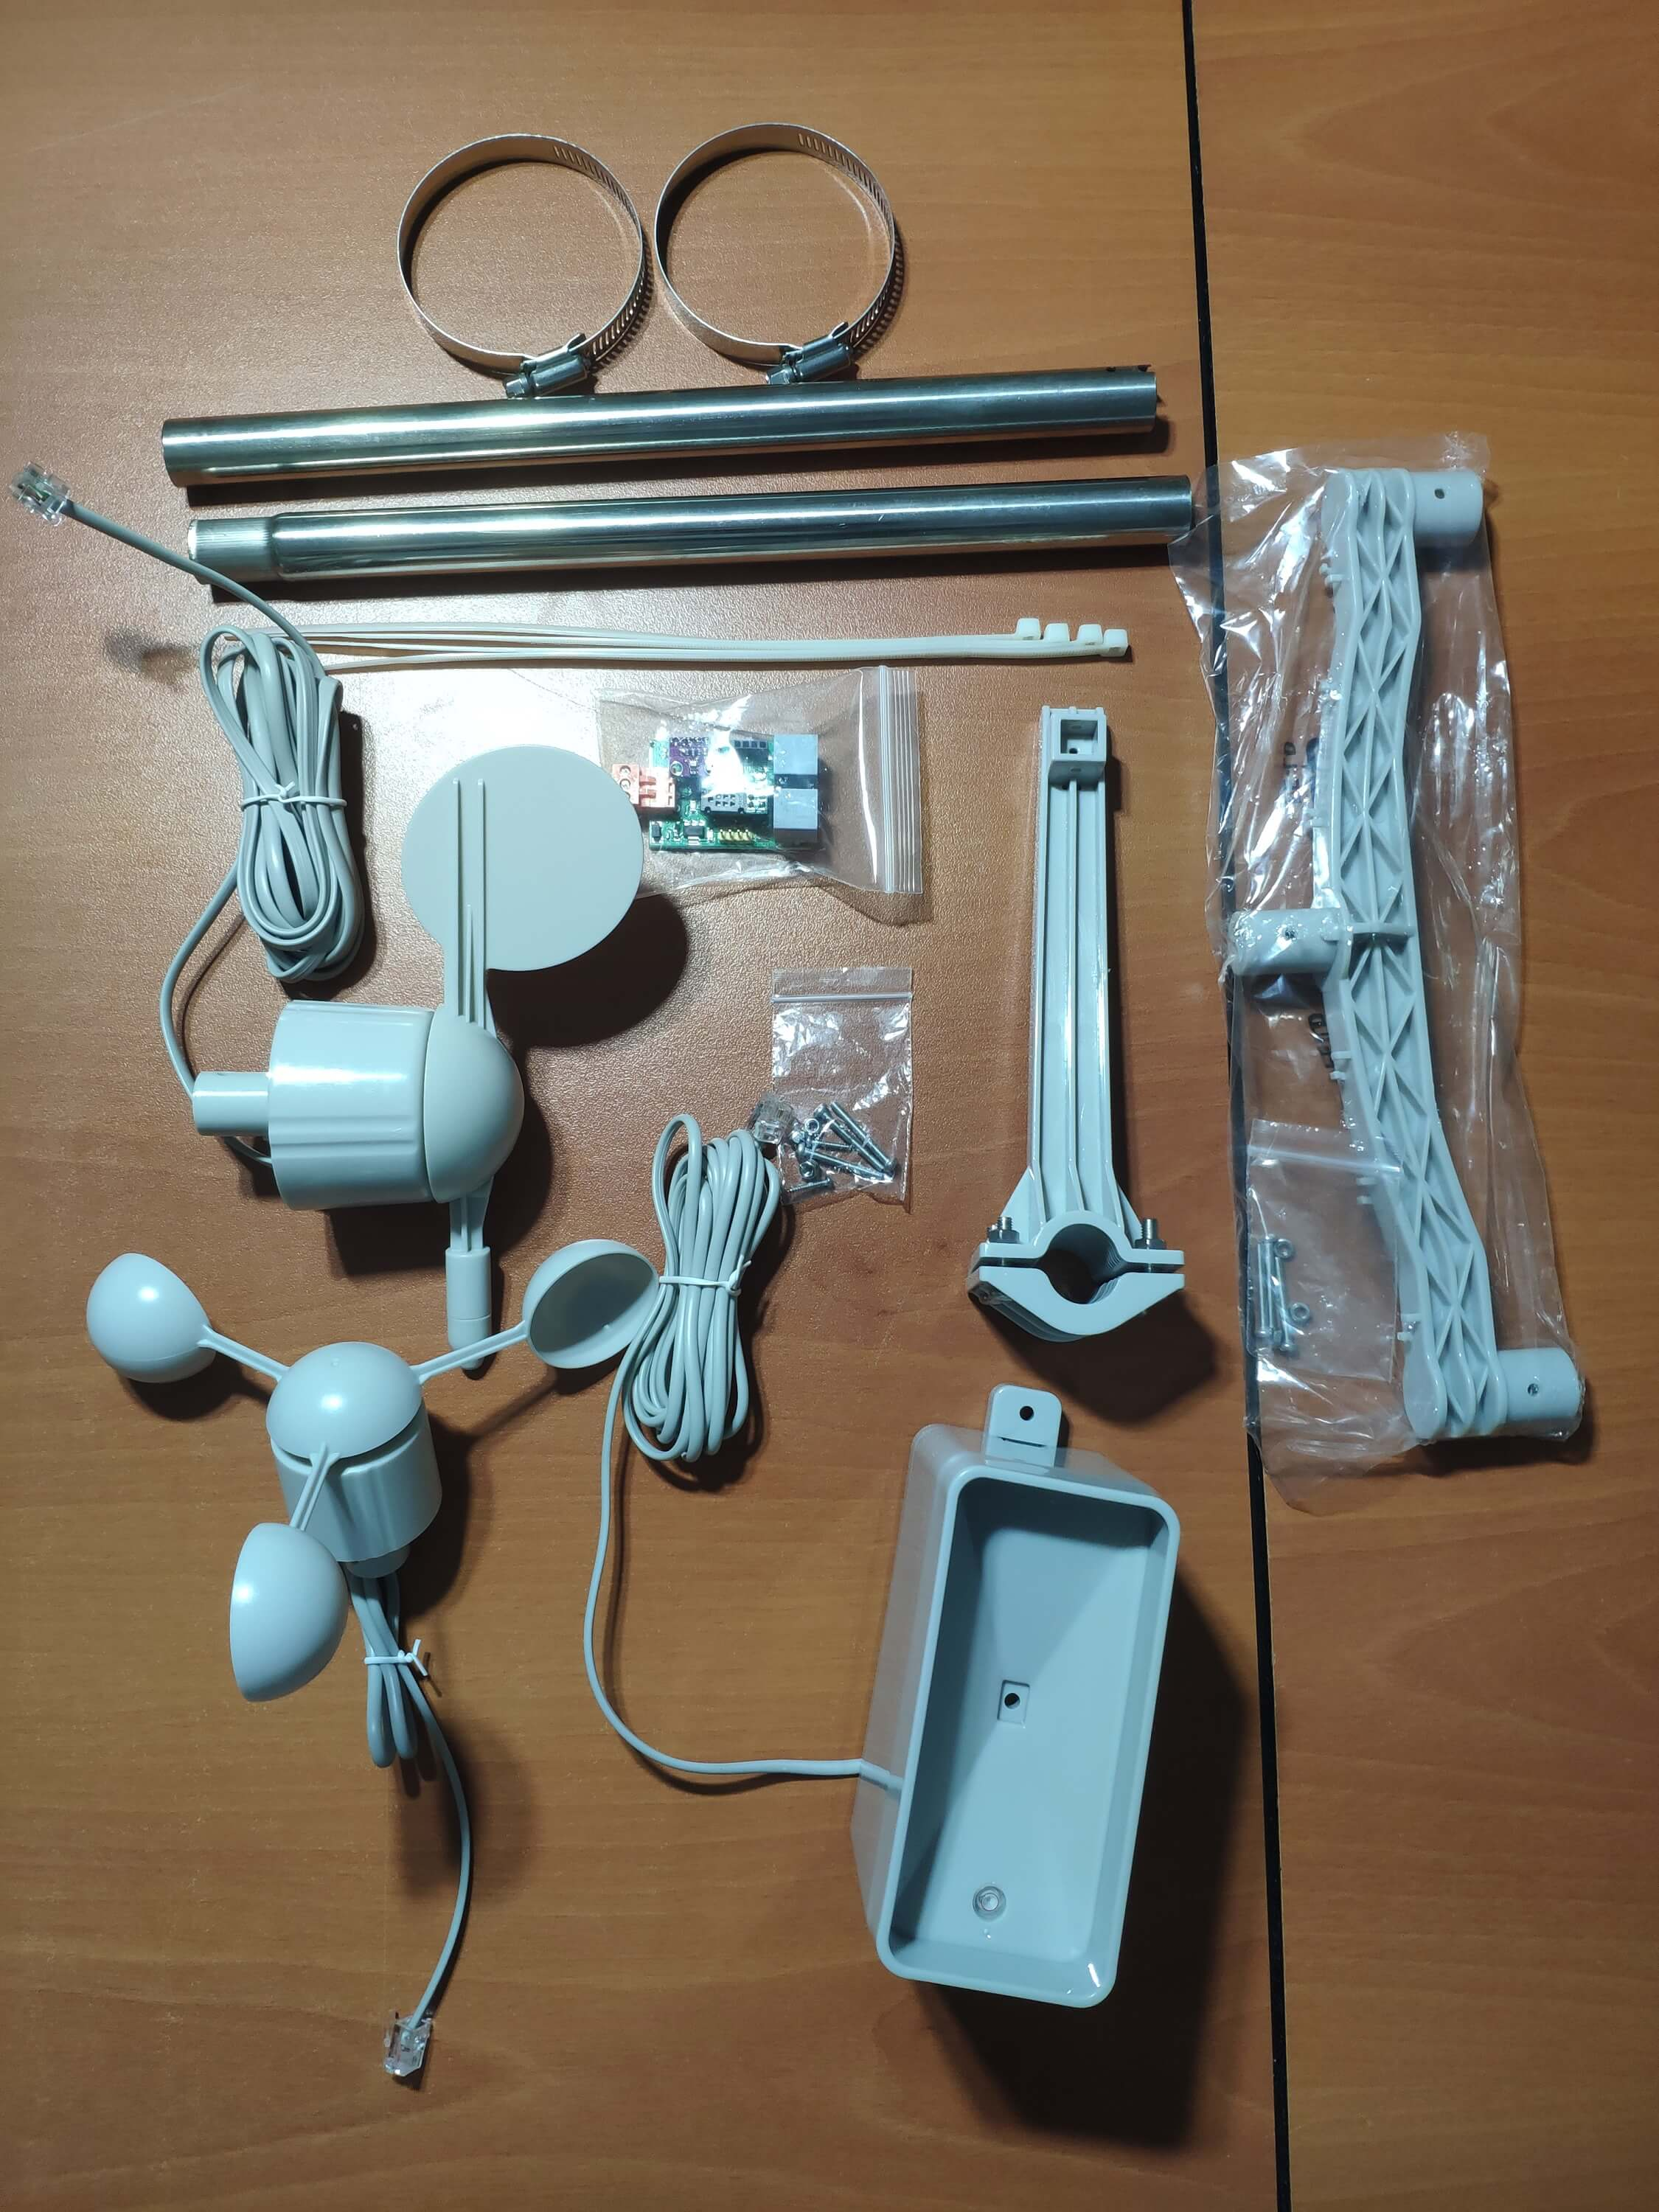
⭐ Ensuite, montez le bâton en acier inoxydable sur le pont avec des vis.
⭐ Installez le joint du seau de pluie sous le seau de pluie avec des vis.
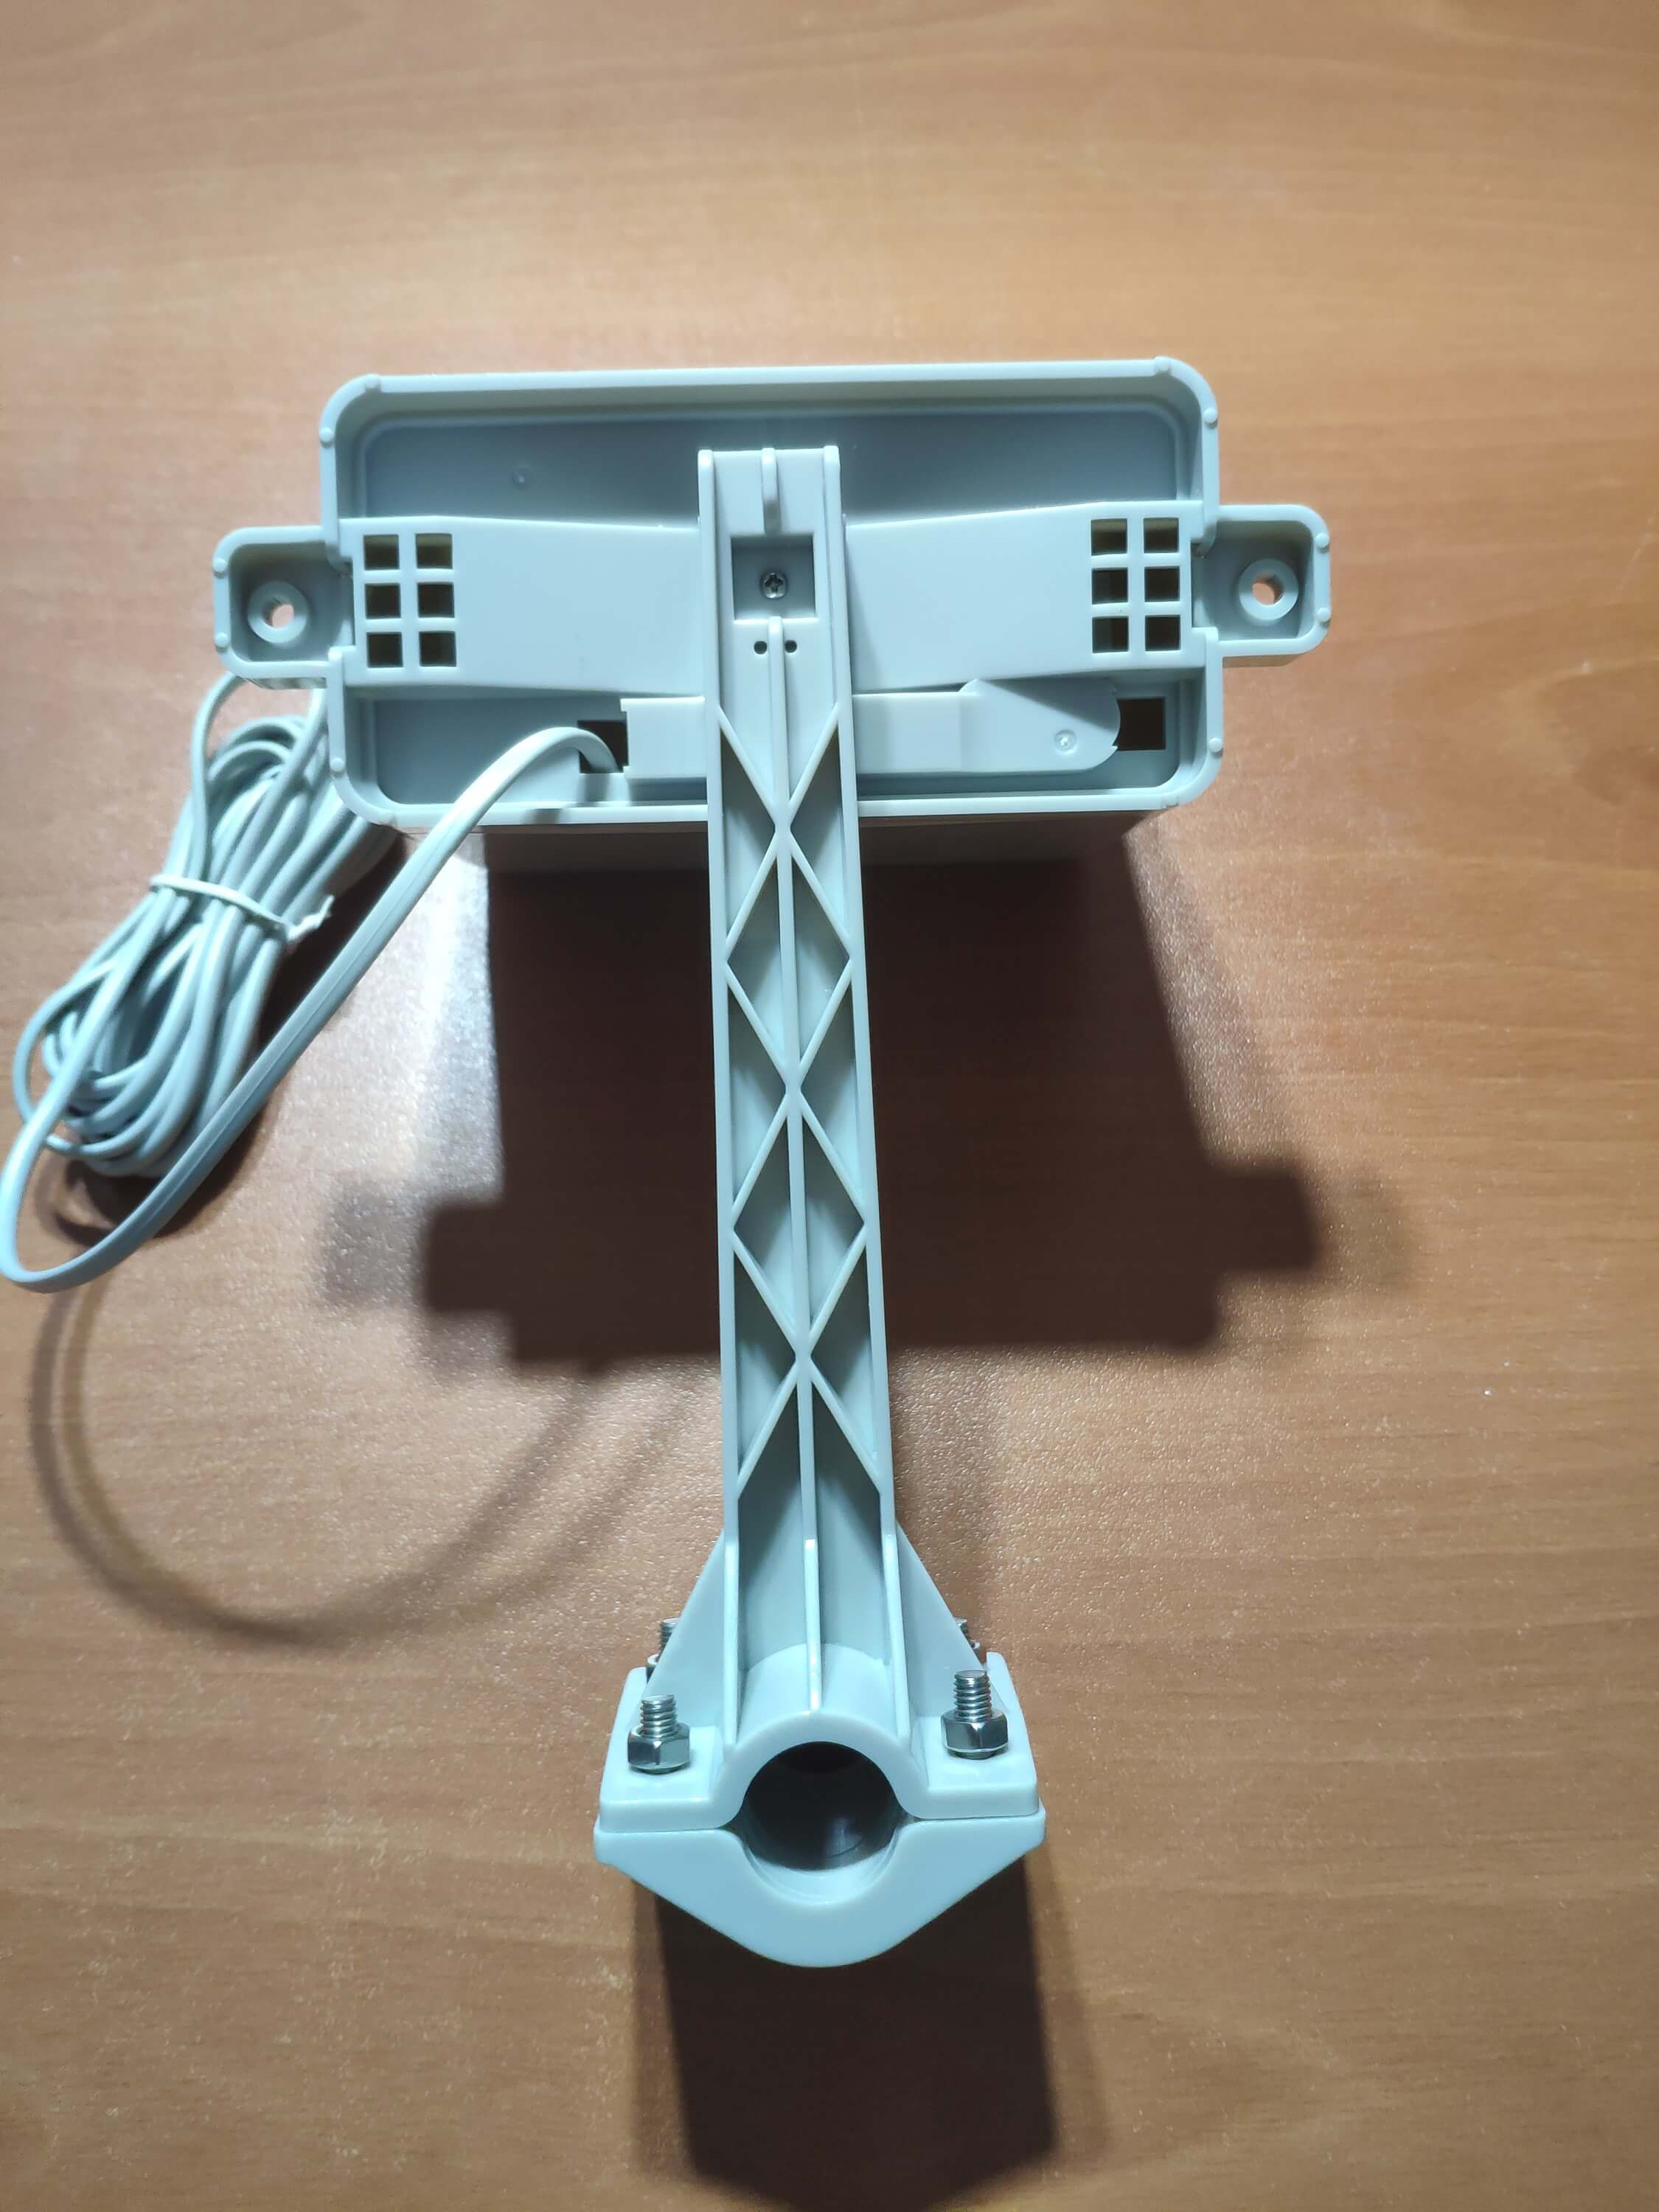
⭐ Enfin, placez le seau de pluie sur le bâton en acier inoxydable à l'aide de vis et d'écrous.
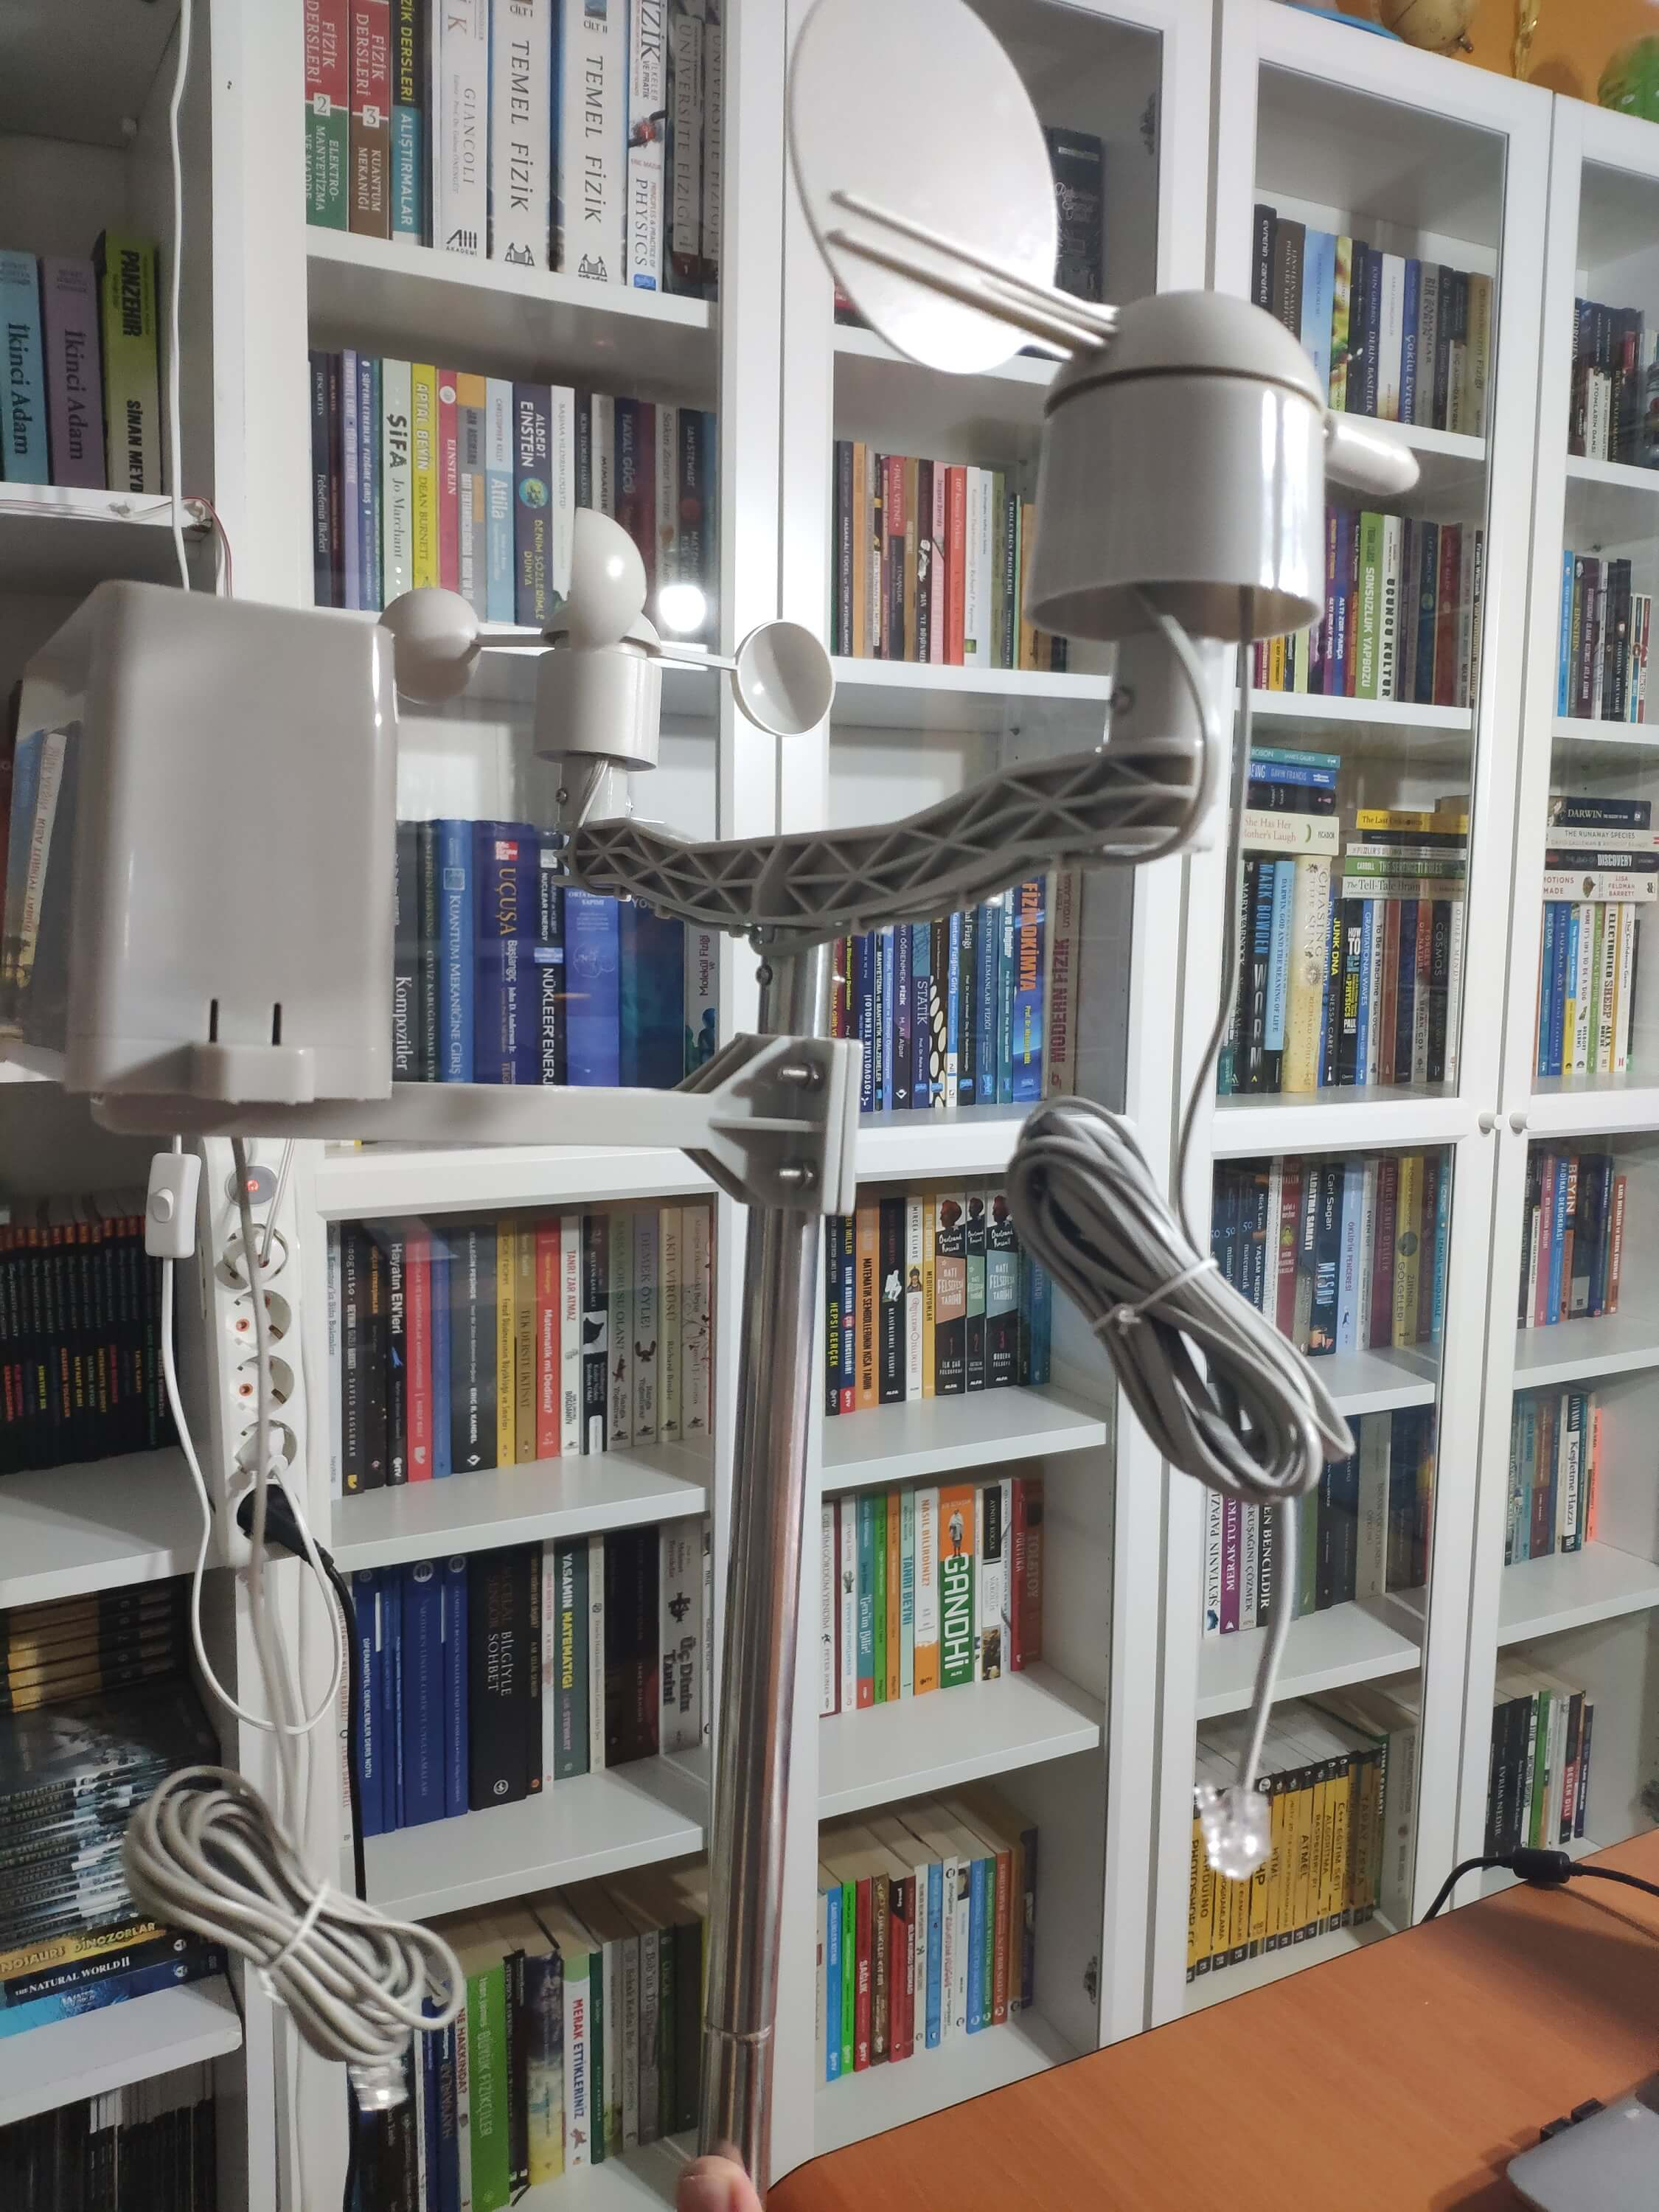
Maintenant, il est prêt à collecter des données météorologiques même dans des conditions météorologiques extrêmes. Cependant, la carte du capteur (convertisseur) n'est pas résistante aux intempéries, j'ai donc ajouté une boîte en plastique à la station météo pour protéger la carte du capteur et le bouclier SIM808 à l'extérieur.
Étape 2 : Collecter des données météorologiques sur Google Sheets
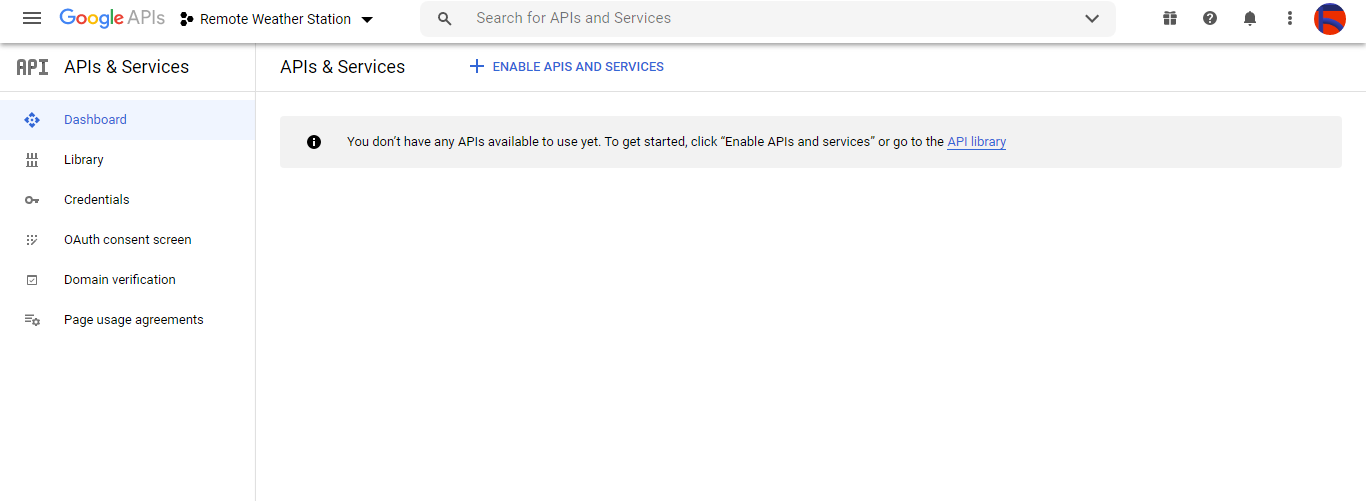
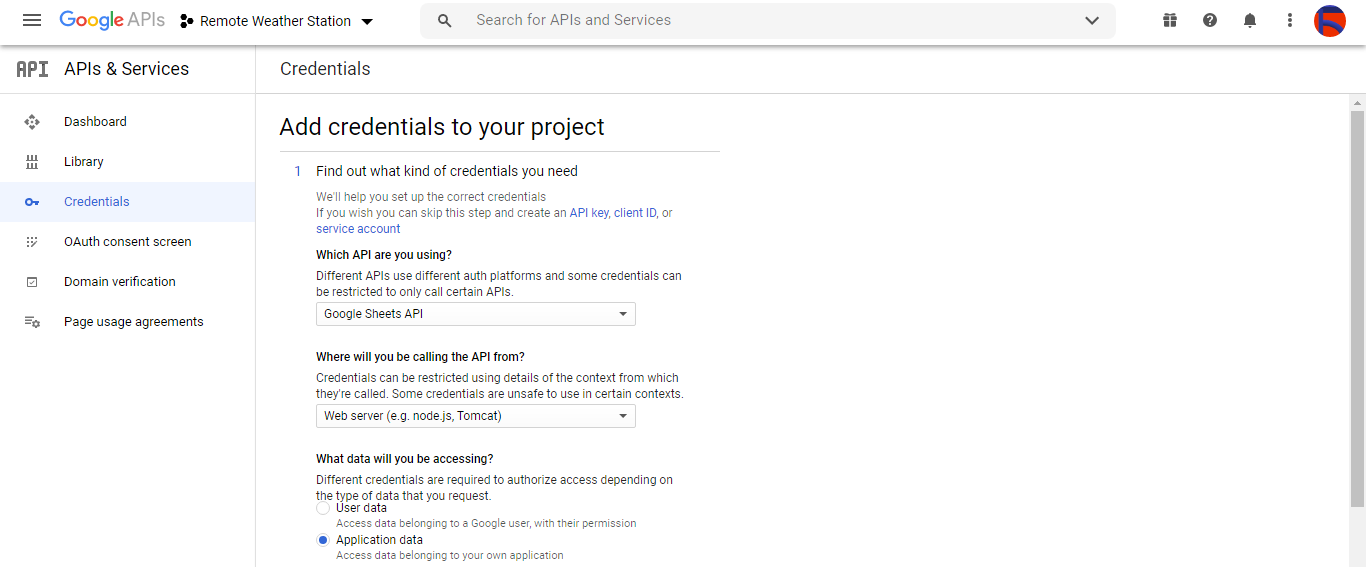
Pour pouvoir envoyer des informations à une feuille de calcul sur Google Sheets, vous devez créer une nouvelle application dans la console développeur de Google et obtenir des informations d'identification pour utiliser l'API Google Sheets. Si vous êtes novice dans la création d'applications avec la console développeur de Google, suivez les instructions ci-dessous.
⭐ Accédez à Google Developer Console et cliquez sur le bouton « NOUVEAU PROJET ». Entrez le nom du projet en tant que Station météorologique à distance .

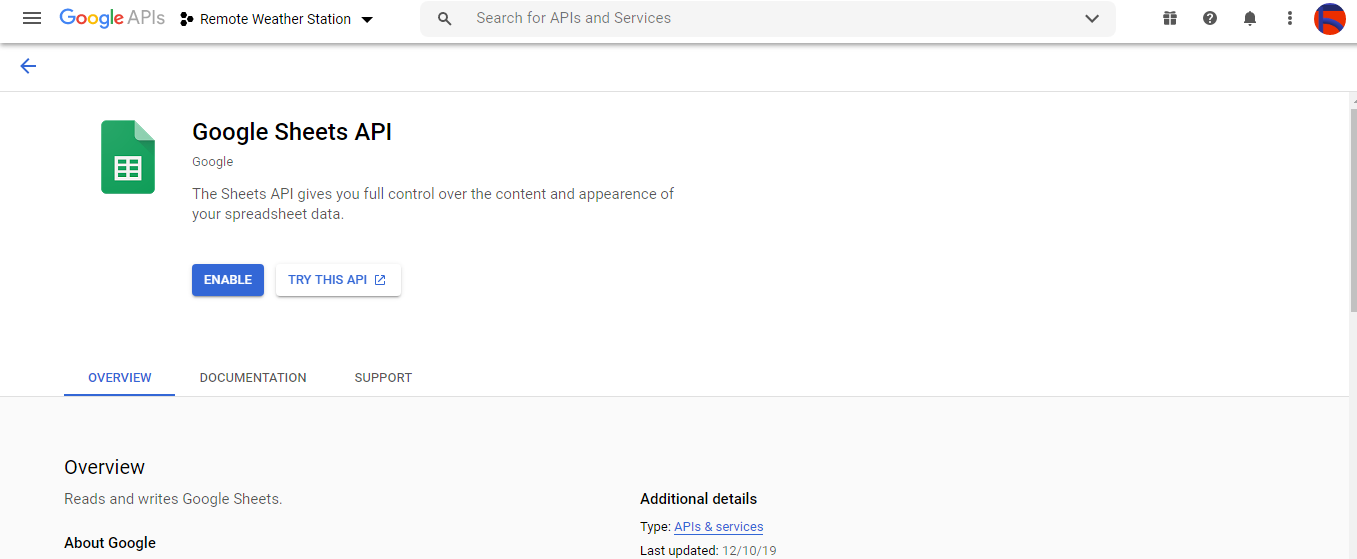
⭐ Accédez aux API &Services et cliquez sur la bibliothèque d'API pour activer l'API Google Sheets.
Étape 2.1 :Obtenir des informations d'identification pour utiliser l'API Google Sheets
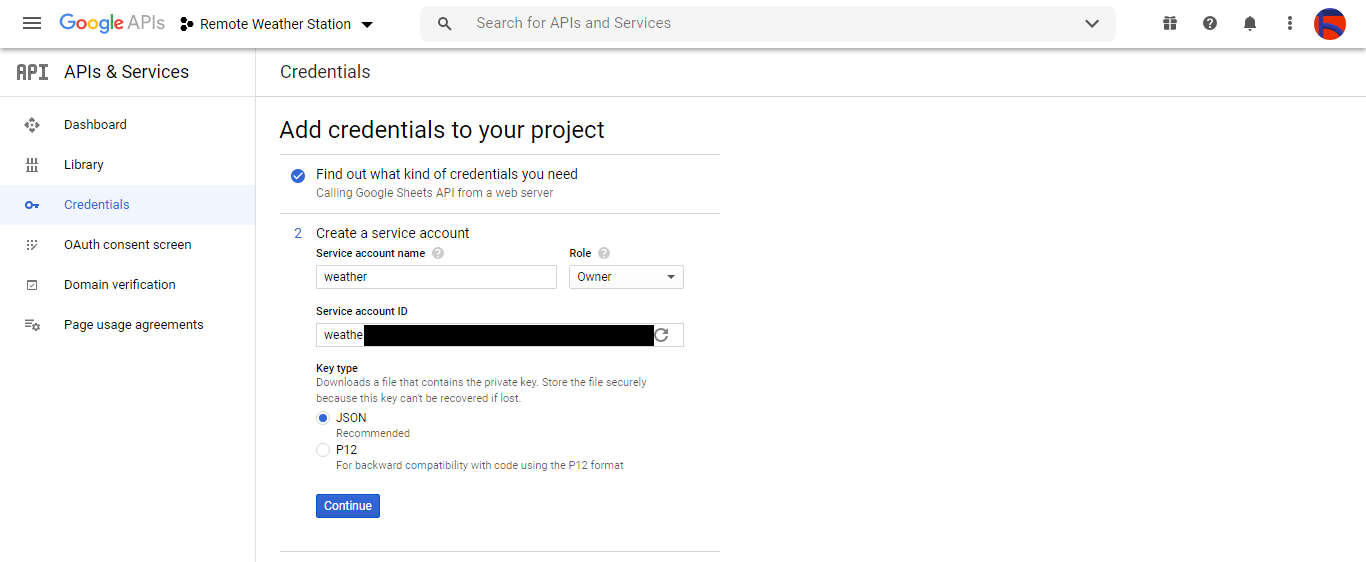
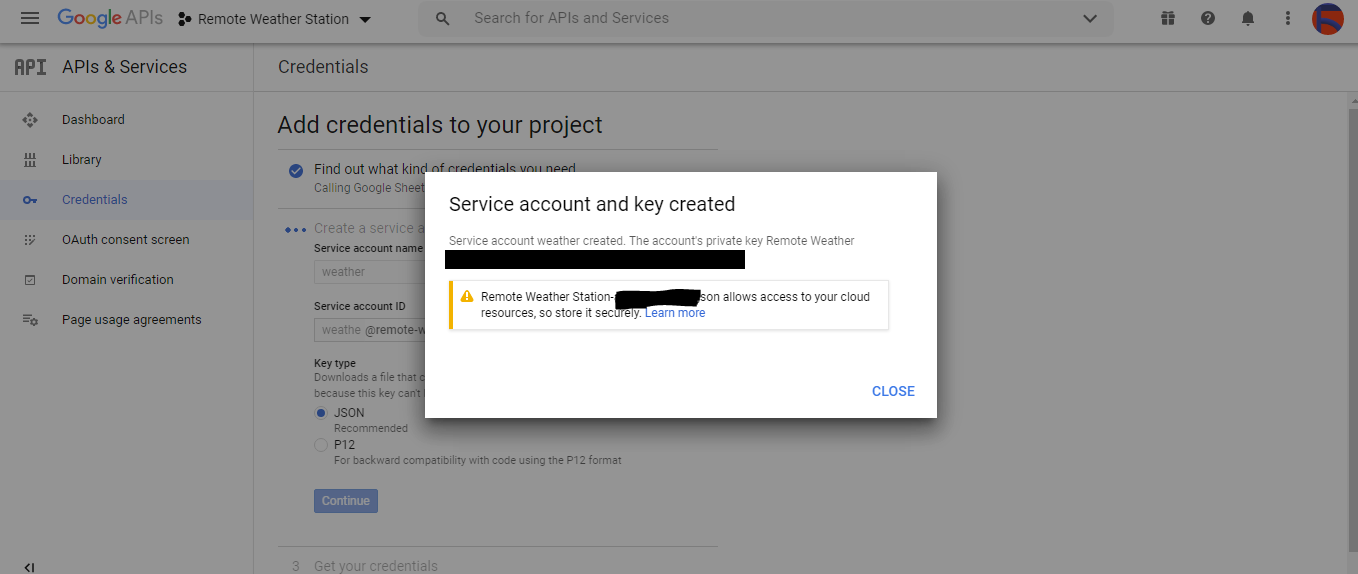
⭐ Ouvrez le tableau de bord du projet et cliquez sur Identifiants bouton. Ensuite, remplissez le formulaire comme illustré ci-dessous pour créer le compte de service et la clé.
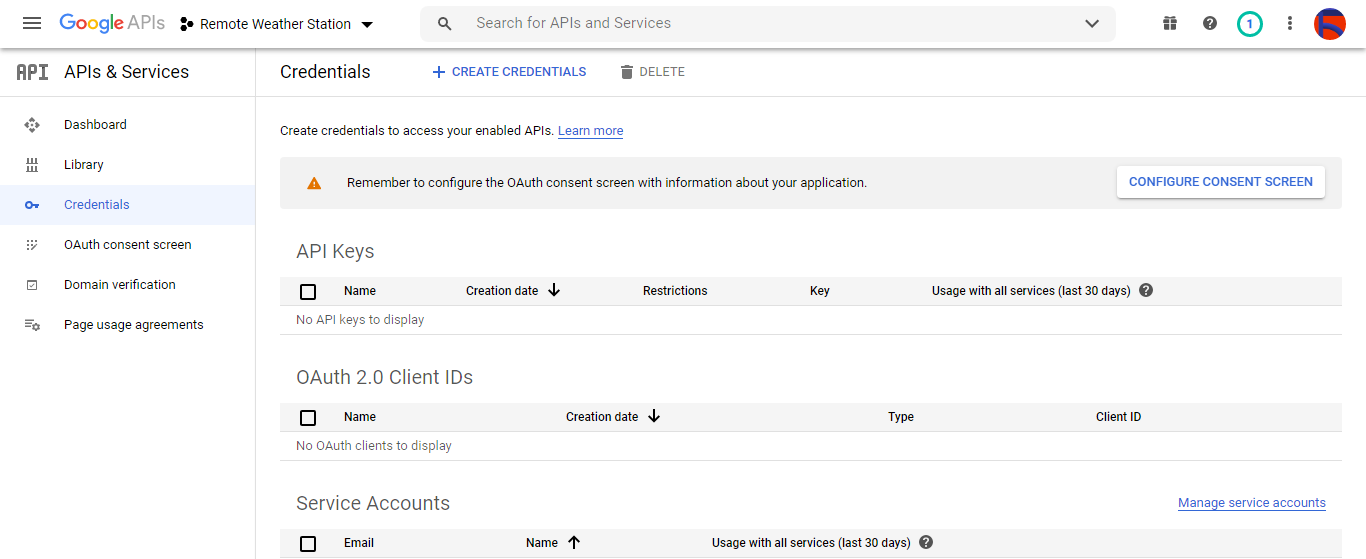
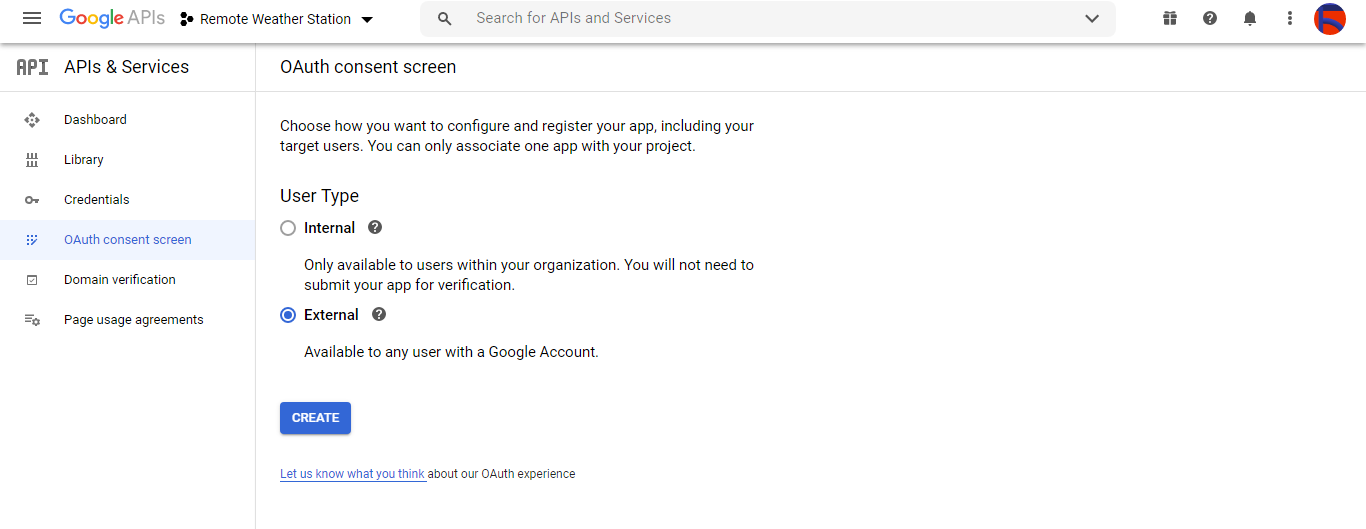
⭐ Cliquez sur CRÉER DES Identifiants et configurez l'écran de consentement pour pouvoir créer un ID client OAuth.
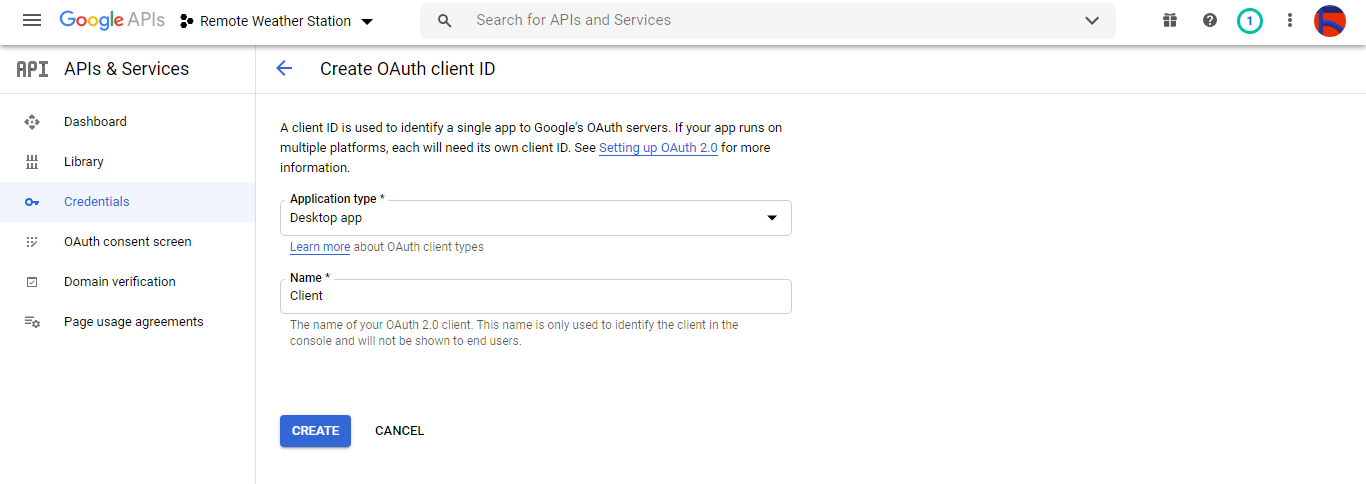
⭐ Ensuite, créez un nouvel ID client OAuth nommé Client sous Application de bureau (type de candidature).
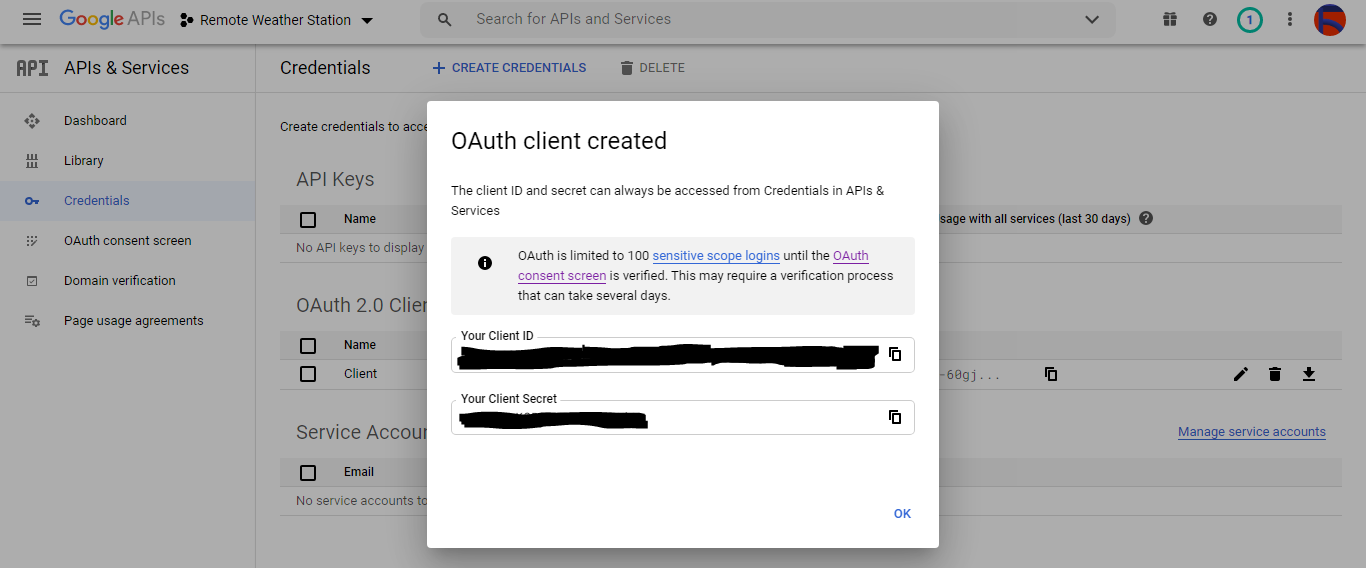
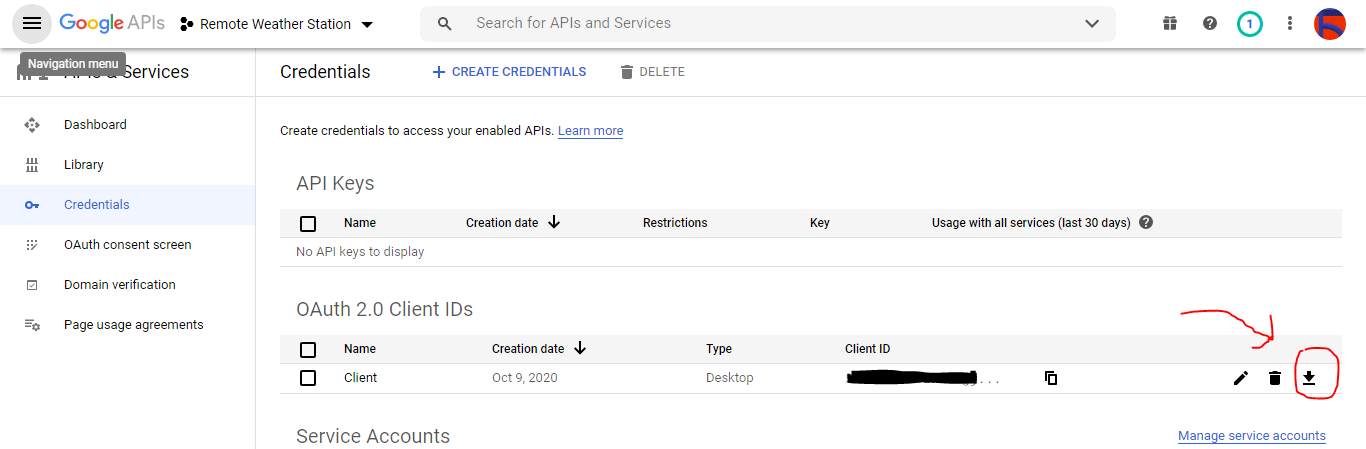
⭐ Après avoir créé l'ID client OAuth (Client) téléchargez les informations d'identification (ID et secret) et nommez le fichier en tant que credentials.json .
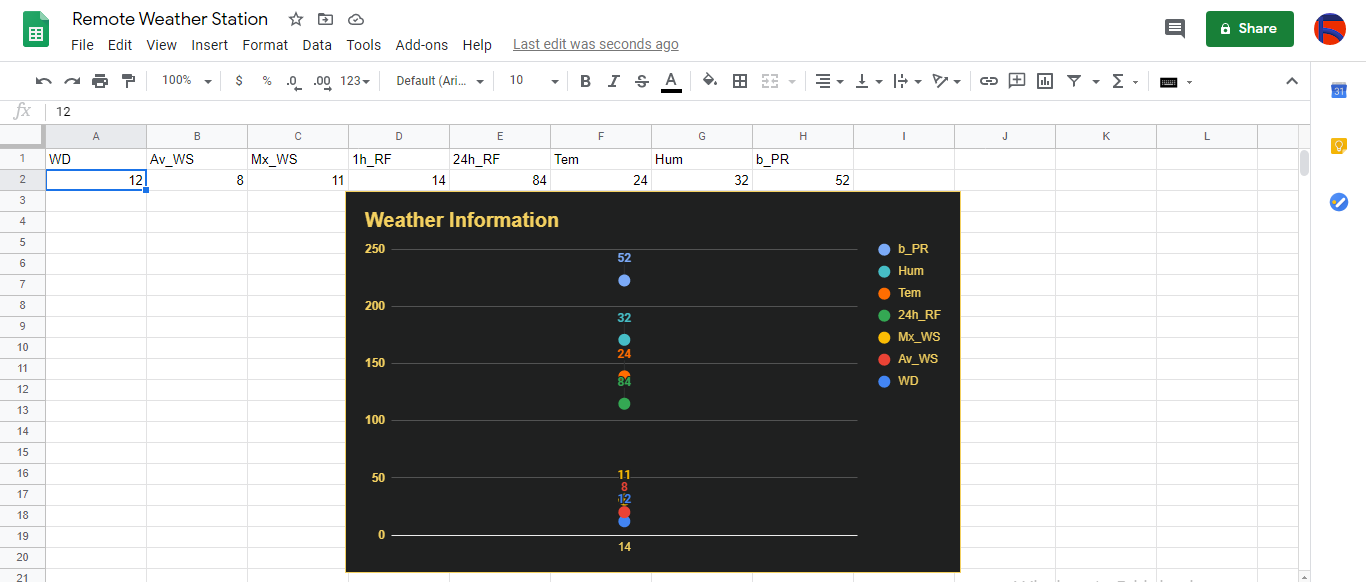
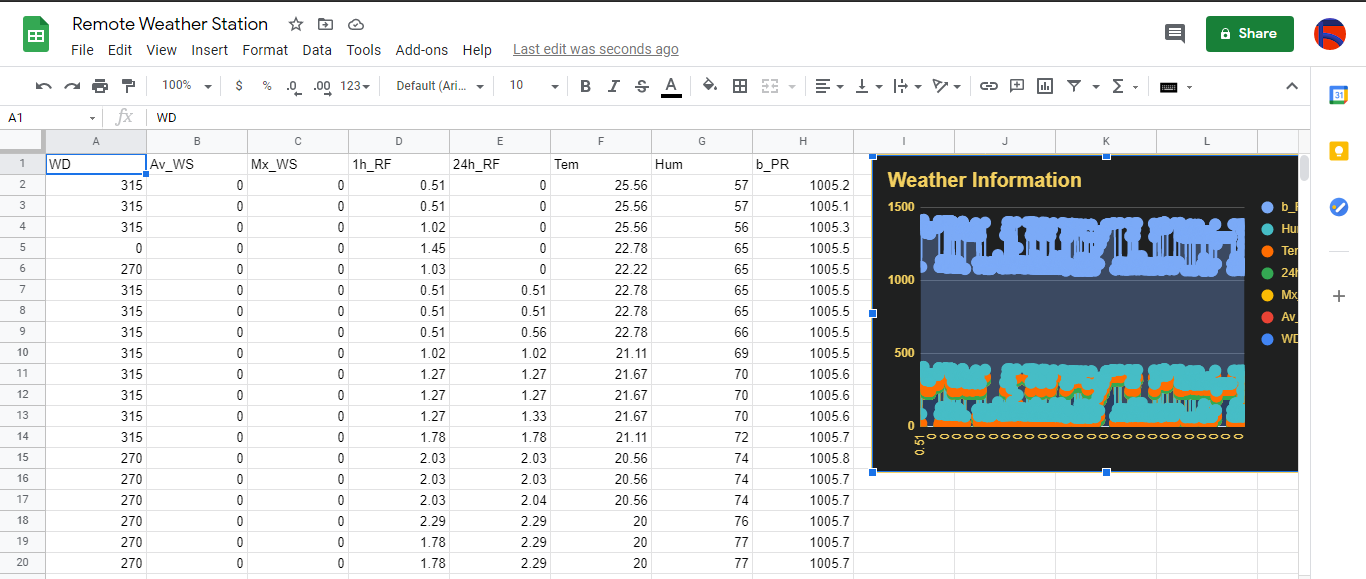
Étape 2.2 : créer une feuille de calcul sur Google Sheets
⭐ Accédez à Google Sheets et sélectionnez Personnel .

⭐ Créez un Vide feuille de calcul et nommez-la Remote Weather Station .
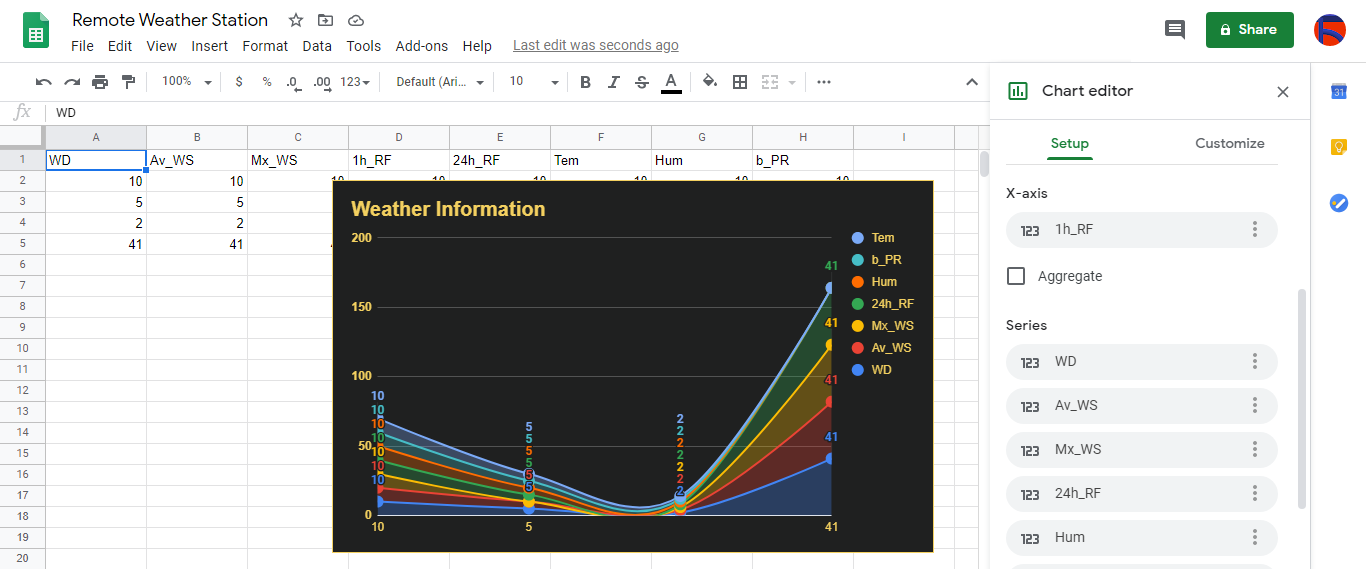
⭐ Ensuite, définissez les noms de colonnes comme première ligne :
- DE
- Av_WS
- Mx_WS
- 1h_RF
- 24h_RF
- Tem
- Hum
- b_PR
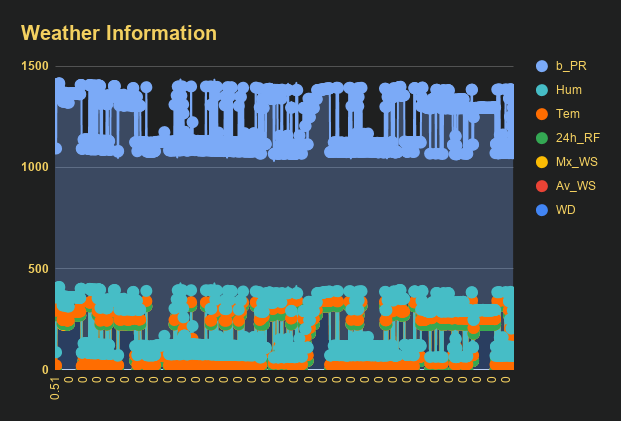
⭐ Si nécessaire, modifiez un graphique pour inspecter les données collectées, comme je l'ai fait.
Étape 3 :Développer une application Web en PHP pour ajouter des données météorologiques à la feuille de calcul
Cette application Web PHP permet d'obtenir des données météo transférées par les cartes de développement (ESP8266 et SIM808) via une requête HTTP Get et d'ajouter ces données à une feuille de calcul donnée (par ID) sur Google Sheets avec des informations d'identification et un jeton vérifiés.
L'application Web nécessite la bibliothèque cliente Google pour PHP pour ajouter des données météorologiques à une feuille de calcul donnée sur Google Sheets.
⭐ Alors, tout d'abord, créez un dossier nommé remote_weather_station sur votre serveur et installez-y la bibliothèque cliente Google pour PHP.
La remote_weather_station Le dossier doit inclure ces quatre fichiers en plus de la bibliothèque cliente Google pour fonctionner :
- index.php
- account_verification_token.php
- credentials.json (Étape 2.1)
- token.json (Étape 3.1)
Dans cette étape, je vais discuter des deux premiers fichiers - index.php et account_verification_token.php :
index.php
⭐ Obtenez des données météorologiques locales de la station météo via une demande Get :
// Direction du vent (wd), Vitesse moyenne du vent (a_ws), Vitesse maximale du vent (m_ws), Précipitations sur 1 h (1_rf), Précipitations sur 24 h (24_rf), Température (tem), Humidité (hum), Pression barométrique (b_pr).
$variables_from_module;
if(isset($_GET['wd']) &&isset($_GET['a_ws']) &&isset($_GET['m_ws'] ) &&isset($_GET['1_rf']) &&isset($_GET['24_rf']) &&isset($_GET['tem']) &&isset($_GET['hum']) &&isset($_GET ['b_pr'])){
$variables_from_module =[
"wd" => (int)$_GET['wd'],
"a_ws" => (float)$_GET ['a_ws'],
"m_ws" => (float)$_GET['m_ws'],
"1_rf" => (float)$_GET['1_rf'],
"24_rf" => (float)$_GET['24_rf'],
"tem" => (float)$_GET['tem'],
"hum" => (int)$_GET ['hum'],
"b_pr" => (float)$_GET['b_pr']
];
}else{
$variables_from_module =[
"wd" => "err",
"a_ws" => "err",
"m_ws" => "err",
"1_rf" => "err",
"24_rf" => "err",
"tem" => "err",
"hum" => "err",
"b_pr" => "err"
];
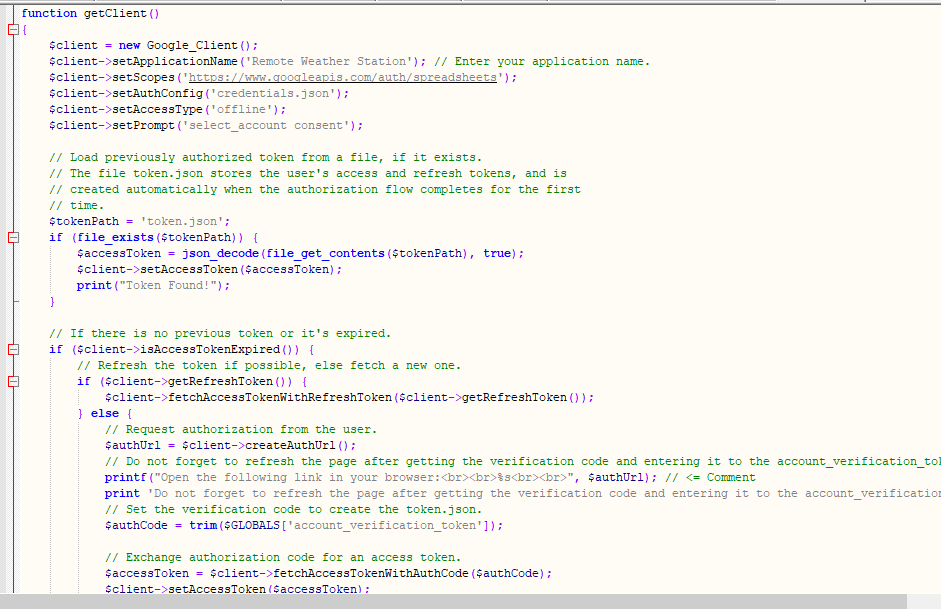
} ⭐ Connectez-vous à l'application Google Developer Console nommée Remote Weather Station en utilisant credentials.json fichier (Étape 2.1) .
$client =new Google_Client();
$client->setApplicationName('Remote Weather Station'); // Saisissez le nom de votre application.
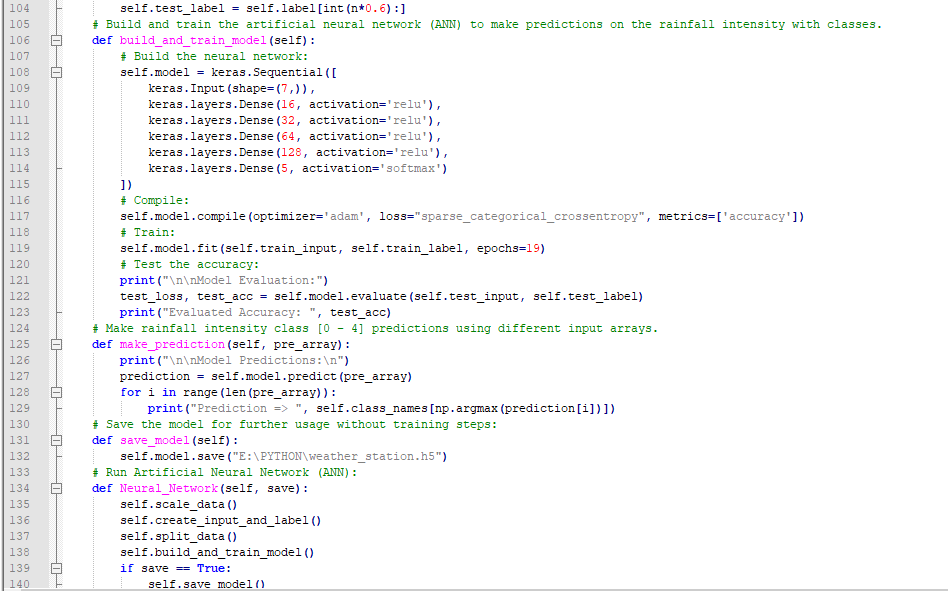
$client->setScopes('https://www.googleapis.com/auth/spreadsheets');
$client->setAuthConfig('credentials.json');
$client->setAccessType('offline');
$client->setPrompt('select_account consent'); ⭐ Charger un token préalablement autorisé à partir d'un fichier (token.json ), s'il existe.
$tokenPath ='token.json';
if (file_exists($tokenPath)) {
$accessToken =json_decode(file_get_contents($tokenPath), true);
$client->setAccessToken($accessToken);
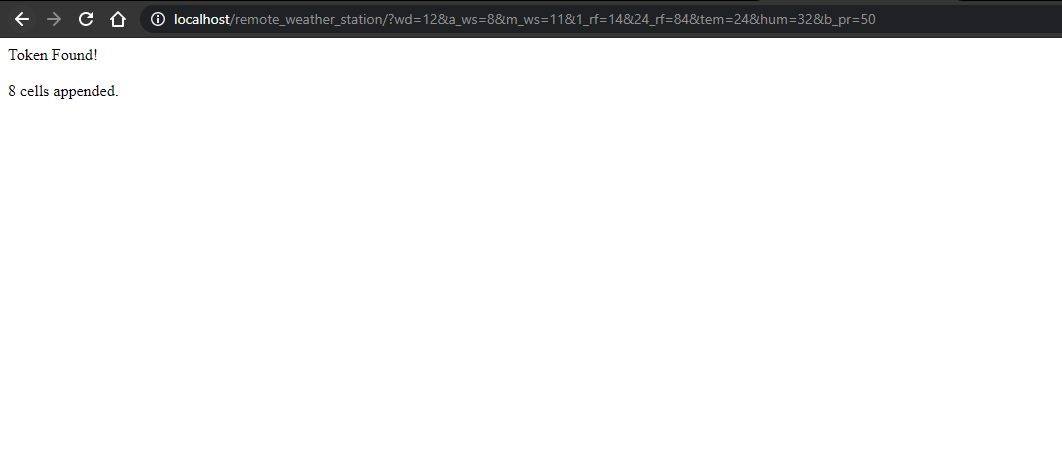
print("Jeton trouvé !");
} ⭐ S'il n'y a pas de token précédent ou expiré, demandez l'autorisation à l'utilisateur et définissez le code de vérification pour créer le token.json fichier avec le file_put_contents() fonction.
if ($client->isAccessTokenExpired()) {
// Actualisez le jeton si possible, sinon récupérez-en un nouveau.
if ($client->getRefreshToken()) {
$client->fetchAccessTokenWithRefreshToken($client->getRefreshToken());
} else {
// Demande l'autorisation de l'utilisateur.
$authUrl =$client->createAuthUrl ();
...
// Définir le code de vérification pour créer le token.json.
$authCode =trim($GLOBALS['account_verification_token' ]);
...
// Vérifiez s'il y a eu une erreur et le account_verification_token est entré.
if (array_key_exists('error', $accessToken)) {
throw new Exception(join(', ', $accessToken));
}else{
print("Réussi ! Rafraîchir la page.");
}
}
// Enregistrer le jeton dans un fichier.
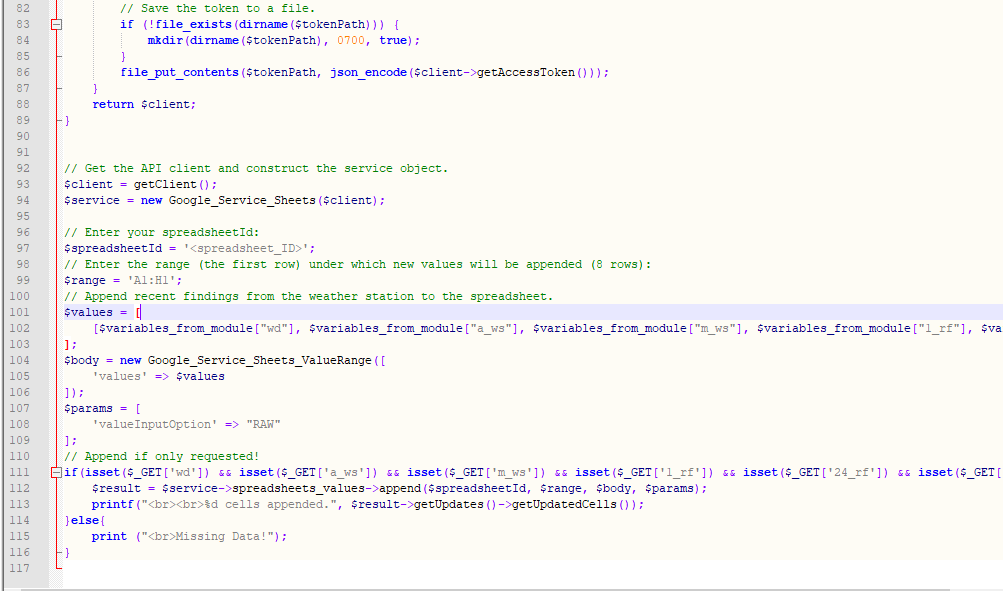
if (!file_exists(dirname($tokenPath))) {
mkdir(dirname($tokenPath), 0700 , true);
}
file_put_contents($tokenPath, json_encode($client->getAccessToken()));
} ⭐ Saisissez l'ID et la plage de la feuille de calcul pour ajouter les résultats récents de la station météo à la feuille de calcul.
https://docs.google.com/spreadsheets/d/spreadsheetId/edit#gid=0
// Saisissez votre spreadsheetId :
$spreadsheetId ='' ;
// Saisissez la plage (la première ligne) sous laquelle les nouvelles valeurs seront ajoutées (8 lignes) :
$range ='A1:H1';
// Ajoute les résultats récents de la station météo à la feuille de calcul.
$values =[
[$variables_from_module["wd" ], $variables_from_module["a_ws"], $variables_from_module["m_ws"], $variables_from_module["1_rf"], $variables_from_module["24_rf"], $variables_from_module["tem"], $variables_from_module["hum $variables_from_module["b_pr"]]
] ;
$body =new Google_Service_Sheets_ValueRange([
'values' => $values
]);
$params =[
'valueInputOption' => "RAW"
];
...
$result =$service->spreadsheets_values->append( $spreadsheetId, $range, $body, $params);
printf("
%d cellules ajoutées.", $result->getUpdates()->getUpdatedCells()); 💻 account_verification_token.php
⭐ Après avoir autorisé l'application Web par l'AuthUrl créée , entrez le code de vérification donné pour définir un jeton d'accès.
$account_verification_token =""; // Entrez le code de vérification après autorisation.
Étape 3.1 :Configuration de l'application Web sur Raspberry Pi (ou n'importe quel serveur)
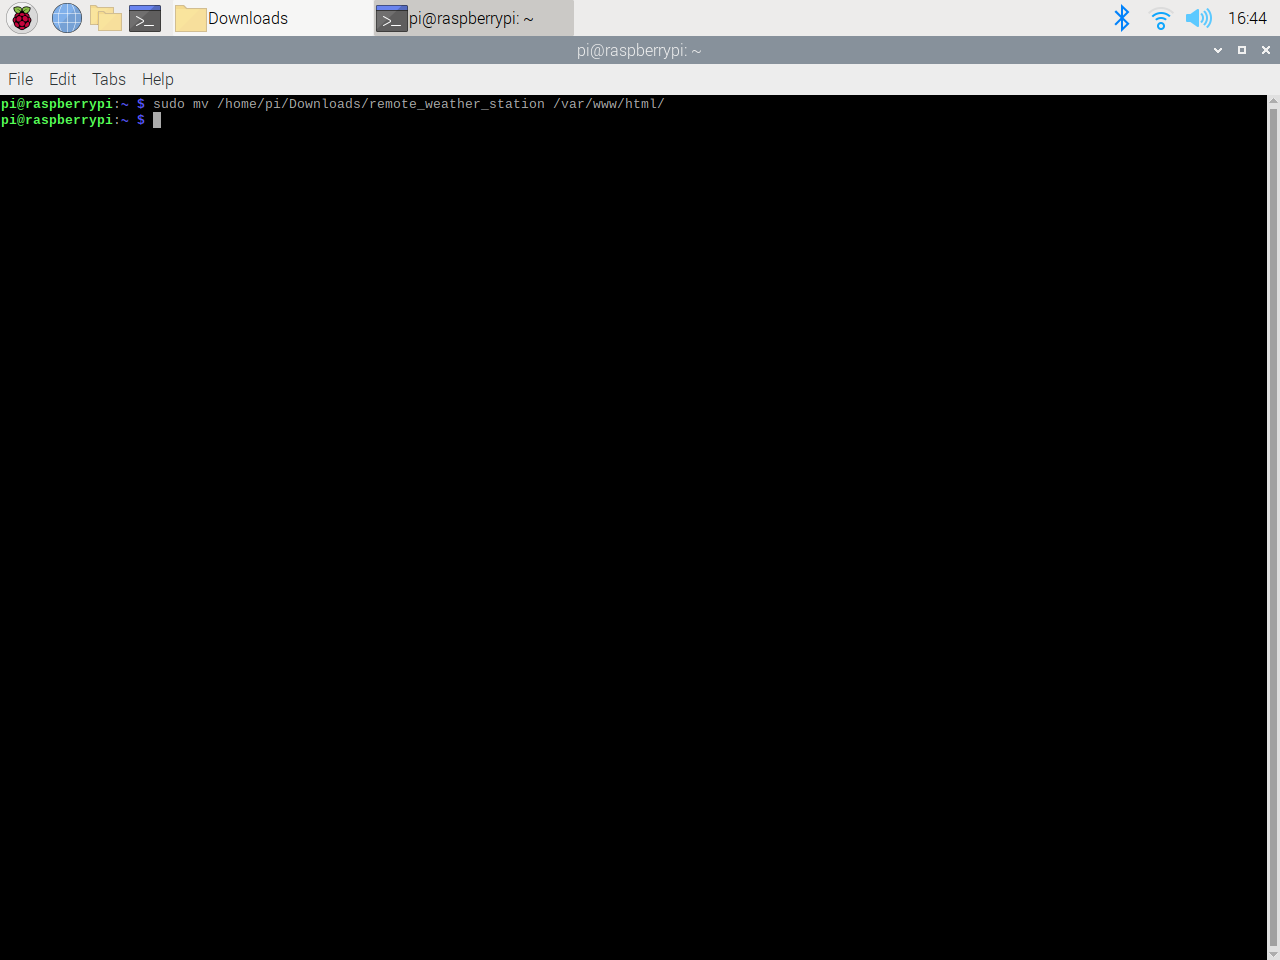
Après avoir créé l'application Web PHP, j'ai décidé de l'exécuter sur mon Raspberry Pi, mais vous pouvez exécuter l'application sur n'importe quel serveur tant qu'il s'agit d'un serveur PHP.
Si vous souhaitez utiliser Raspberry Pi mais ne savez pas comment configurer un serveur Web LAMP sur Raspberry Pi, vous pouvez consulter ce tutoriel.
⭐ Tout d'abord, déplacez le dossier de l'application (remote_weather_station) vers le serveur apache (/var/www/html) en utilisant le terminal car le serveur apache est un emplacement protégé.
sudo mv /home/pi/Downloads/remote_weather_station /var/www/html/
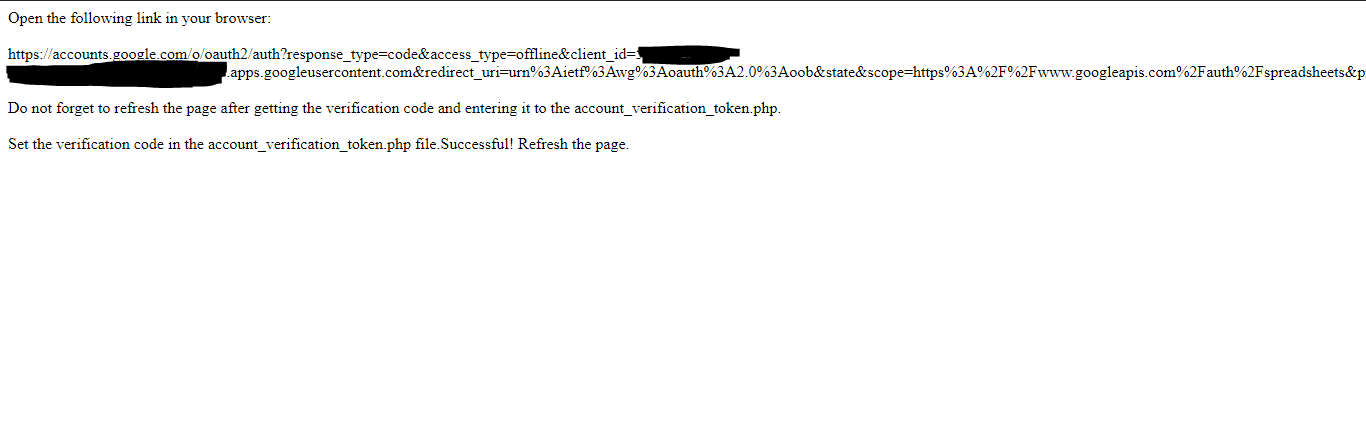
⭐ L'application Web renvoie une erreur lorsqu'elle est ouverte pour la première fois en raison du code de vérification manquant. Pour obtenir le code de vérification, rendez-vous sur le lien d'autorisation généré par l'application.
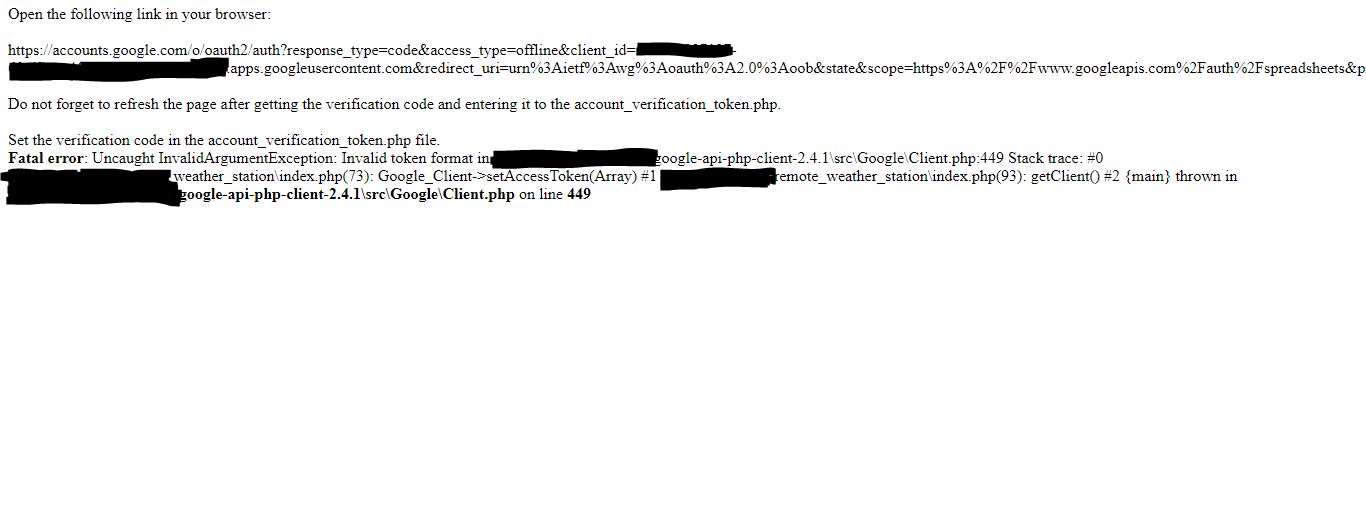
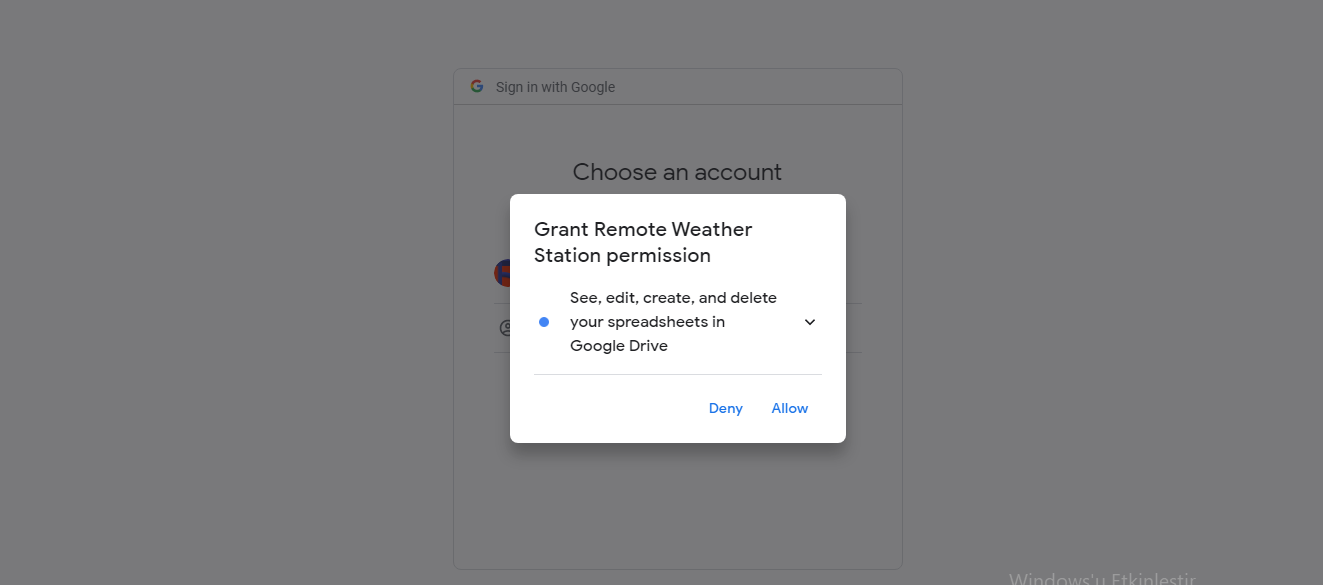
⭐ Ensuite, cliquez pour Aller à la station météorologique distante (dangereux) .
⭐ Accordez l'application avec les autorisations requises.
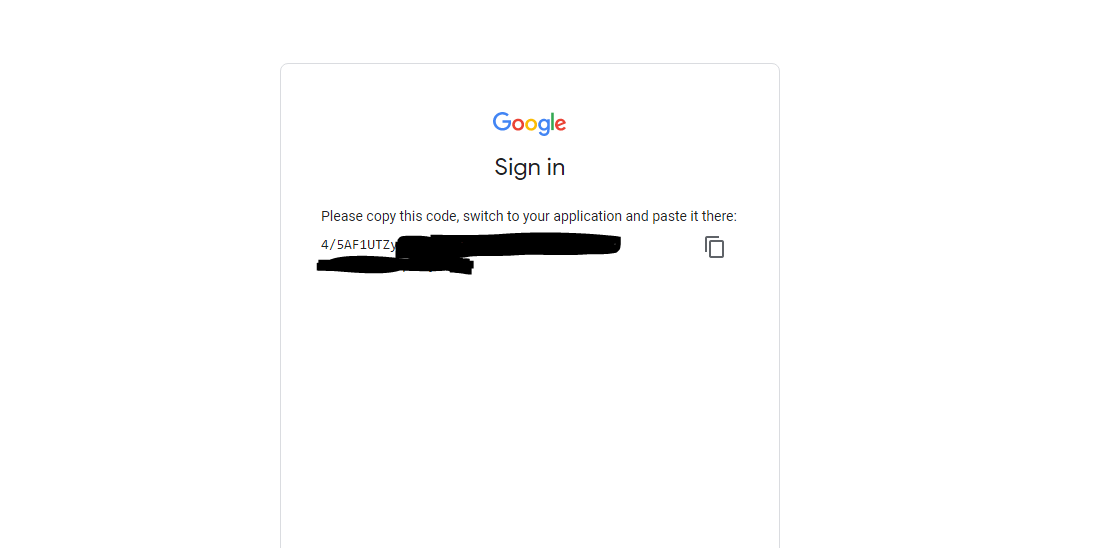
⭐ Maintenant, copiez le code de vérification et collez-le dans account_verification_token.php .
Revenez à l'application Web. Il devrait afficher le message de confirmation :Réussi ! Rafraîchir la page .
⭐ Après avoir rafraîchi la page, l'application Web utilise le code de vérification pour obtenir un jeton d'accès et enregistre le jeton d'accès dans un fichier nommé token.json . Ainsi, il ne renvoie plus d'erreur.

⭐ Pour tester si l'application Web PHP ajoute de nouvelles données à la feuille de calcul donnée avec précision :
http://localhost/remote_weather_station/?wd=12&a_ws=8&m_ws=11&1_rf=14&24_rf=84&tem=24&hum=32&b_pr=57
Étape 4 :Lecture et envoi des données météo avec ESP8266 (WiFi)
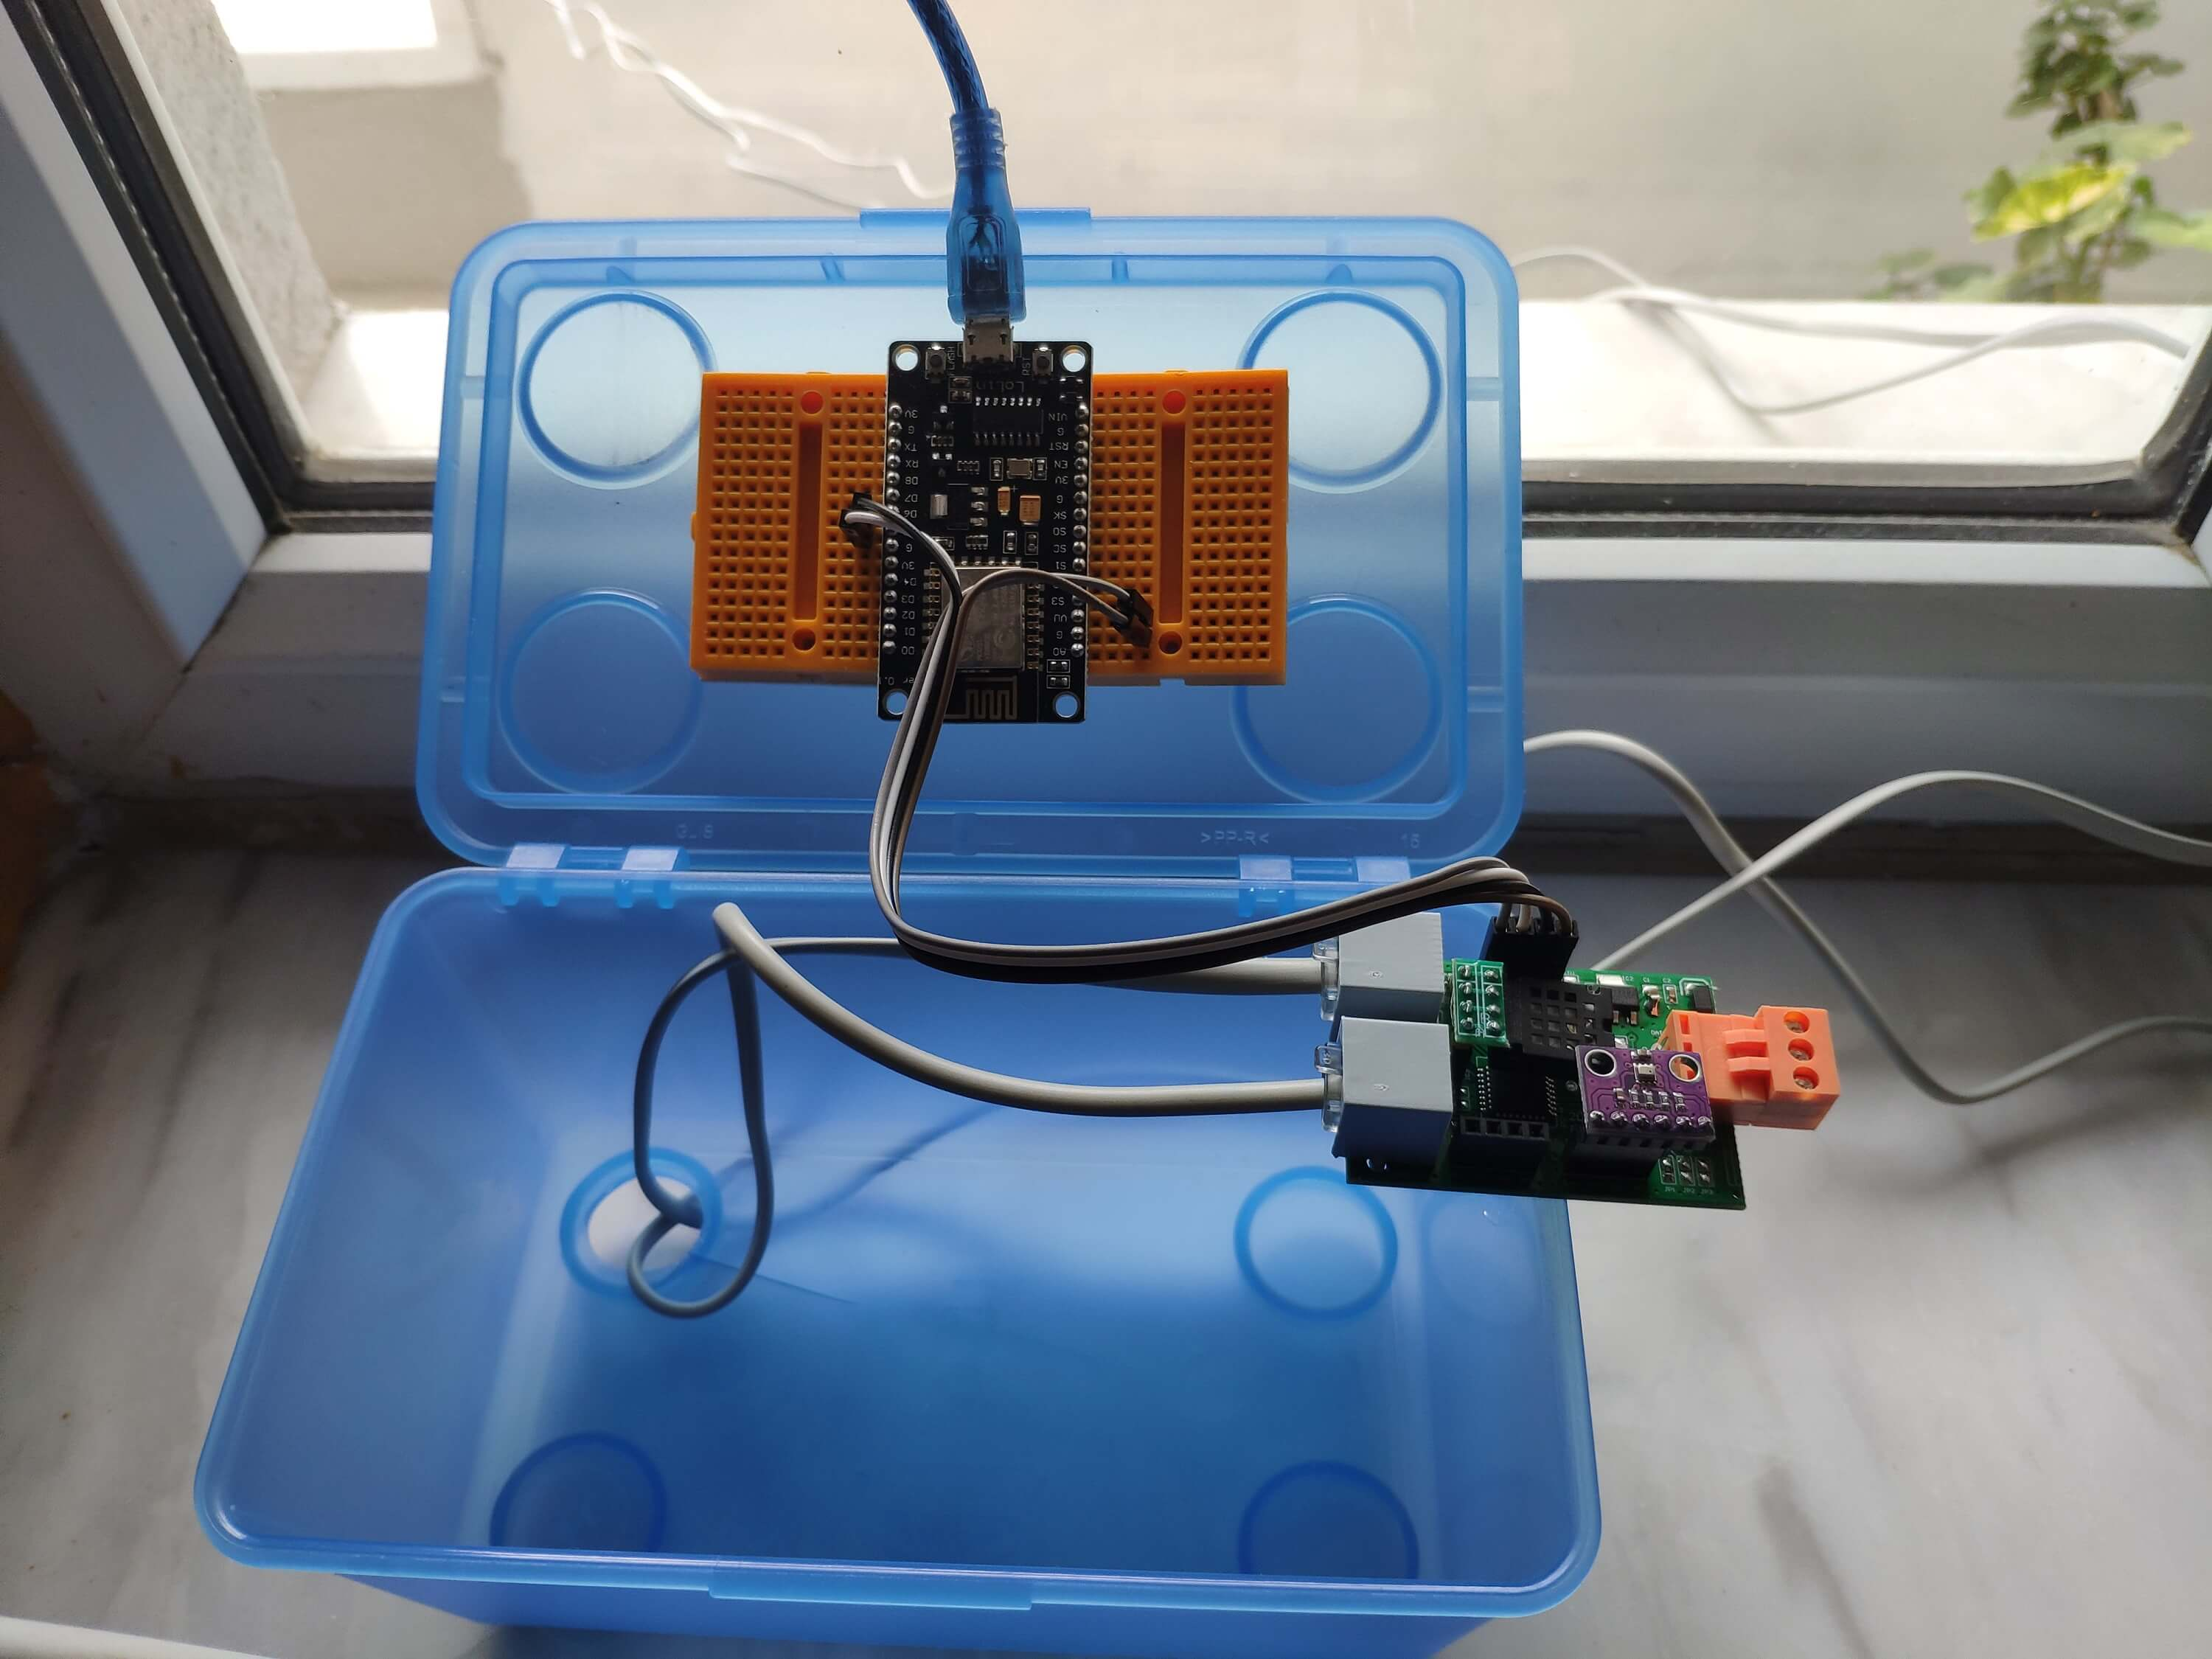
Pour collecter des données météorologiques sur mon balcon, j'ai utilisé une carte de développement NodeMCU ESP-12E (ESP8266) avec la station météo.
Je l'ai programmé pour envoyer des données météo à l'application Web PHP toutes les cinq minutes.

Incluez les bibliothèques requises et définissez les paramètres WiFi.
#include
#include
#include
#include
 #include

// Définissez vos paramètres WiFi.
const char *ssid ="";
const char *password =" ";
⭐ Définissez les paramètres de la station météo et les broches de connexion série - D6, D5.
// Définir les paramètres de la station météo :
char databuffer[35] ;
double temp ;
int transfer =0 ;

// Définir les broches de connexion série - RX et TX.
SoftwareSerial Serial_1(D6, D5) ; // (Rx, Tx)
Dans le getBuffer() fonction, obtenez des données de la station météo.
void getBuffer(){
index int;
pour (index =0;index <35;index ++){
if(Serial_1.available()){
databuffer[index] =Serial_1.read();
if (databuffer[0] !='c'){
index =-1;
}
}
else{
index --;
}
}
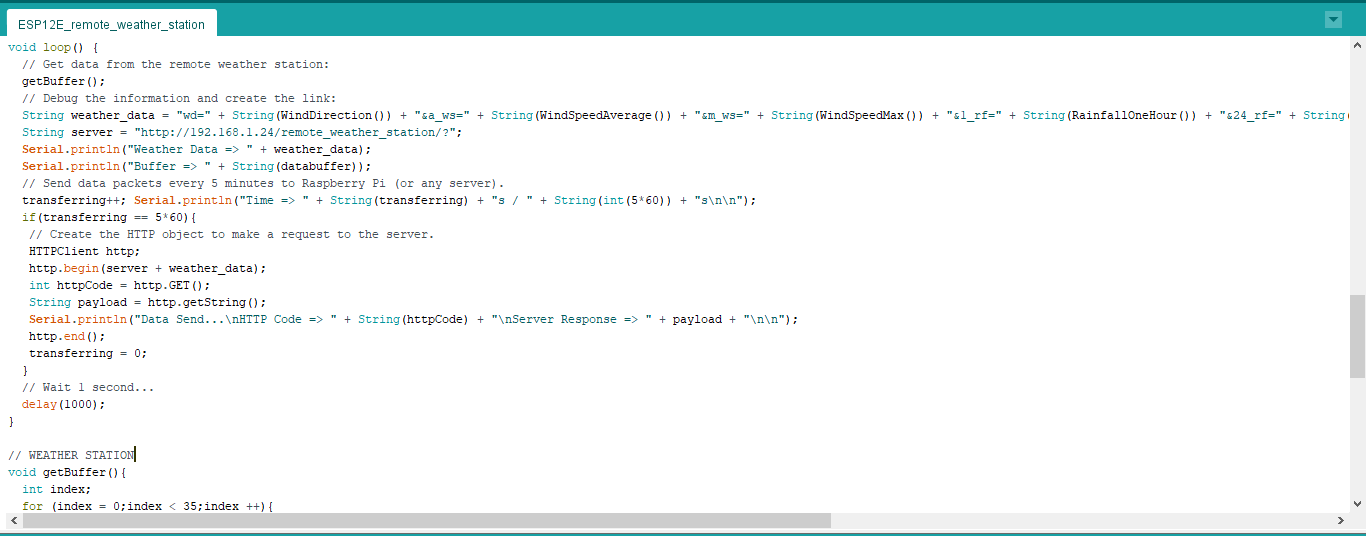
} ⭐ Déboguer les données météo et créer le lien.
Chaîne weather_data ="wd=" + Chaîne(WindDirection()) + "&a_ws=" + Chaîne(WindSpeedAverage()) + "&m_ws=" + Chaîne(WindSpeedMax()) + "&1_rf=" + Chaîne(RainfallOneHour()) + "&24_rf=" + String(RainfallOneDay()) + "&tem=" + String(Temperature()) + "&hum=" + String(Humidity()) + "&b_pr=" + String( BarPressure());
Serveur de chaînes ="http://192.168.1.24/remote_weather_station/?";

...

int WindDirection(){ return transCharToInt(databuffer,1,3) ; } // Direction du vent (deg)

float WindSpeedAverage(){ temp =0.44704 * transCharToInt(databuffer,5,7); température de retour ; } // Vitesse moyenne de l'air (1 minute)

float WindSpeedMax(){ temp =0.44704 * transCharToInt(databuffer,9,11); température de retour ; } //Vitesse de l'air max (5 minutes)

Température flottante(){ temp =(transCharToInt(databuffer,13,15) - 32.00) * 5.00 / 9.00; température de retour ; } // Température ("C")

float RainfallOneHour(){ temp =transCharToInt(databuffer,17,19) * 25.40 * 0.01; température de retour ; } // Précipitations (1 heure)

float RainfallOneDay(){ temp =transCharToInt(databuffer,21,23) * 25.40 * 0.01; température de retour ; } // Précipitations (24 heures)

int Humidity(){ return transCharToInt(databuffer,25,26); } // Humidité (%)

float BarPressure(){ temp =transCharToInt(databuffer,28,32); température de retour / 10,00 ; } // Pression barométrique (hPA)
⭐ Envoyez des paquets de données toutes les 5 minutes à Raspberry Pi (ou n'importe quel serveur).
transfert++ ; Serial.println("Time => " + String(transfert) + "s / " + String(int(5*60)) + "s\n\n");
 if(transferring ==5* 60){
 // Crée l'objet HTTP pour faire une requête au serveur.
 HTTPClient http ;
 http.begin(server + weather_data);
 int httpCode =http.GET();
 String payload =http.getString();
 Serial.println("Data Send...\nHTTP Code => " + String(httpCode) + "\nServer Response => " + payload + "\n\n");
 http.end();
 transfer =0;
 }
 // Attendez 1 seconde...
 delay(1000);
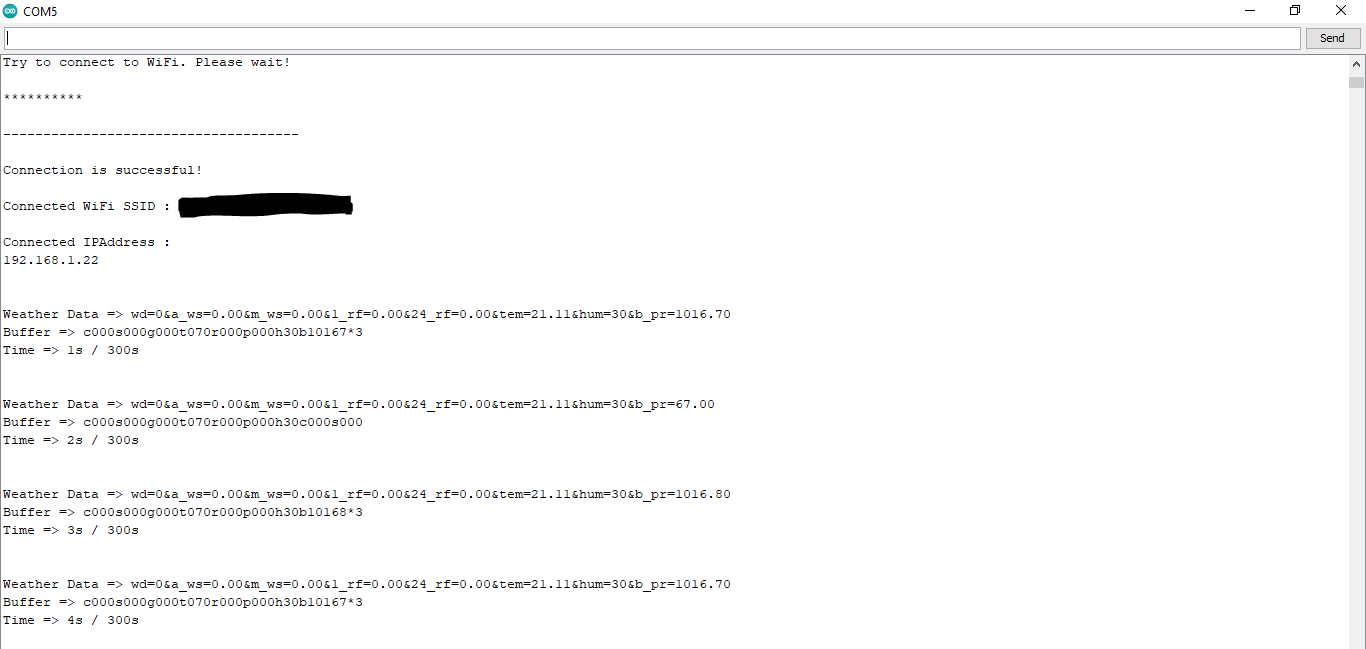
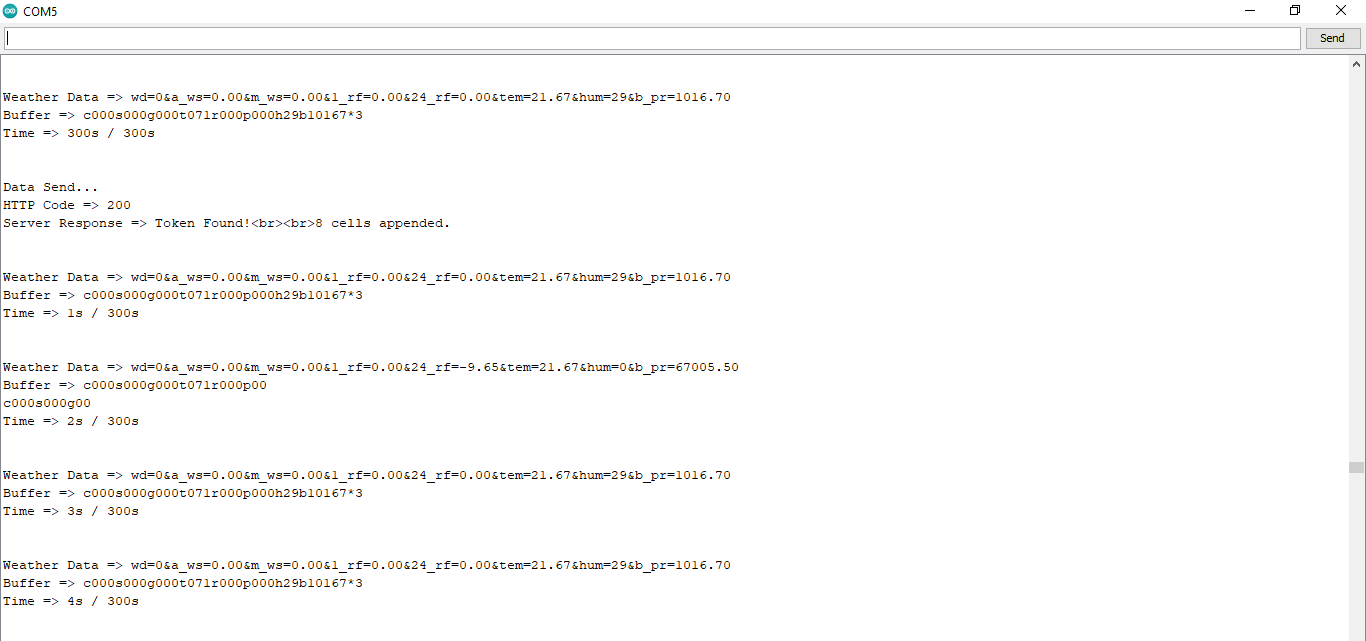
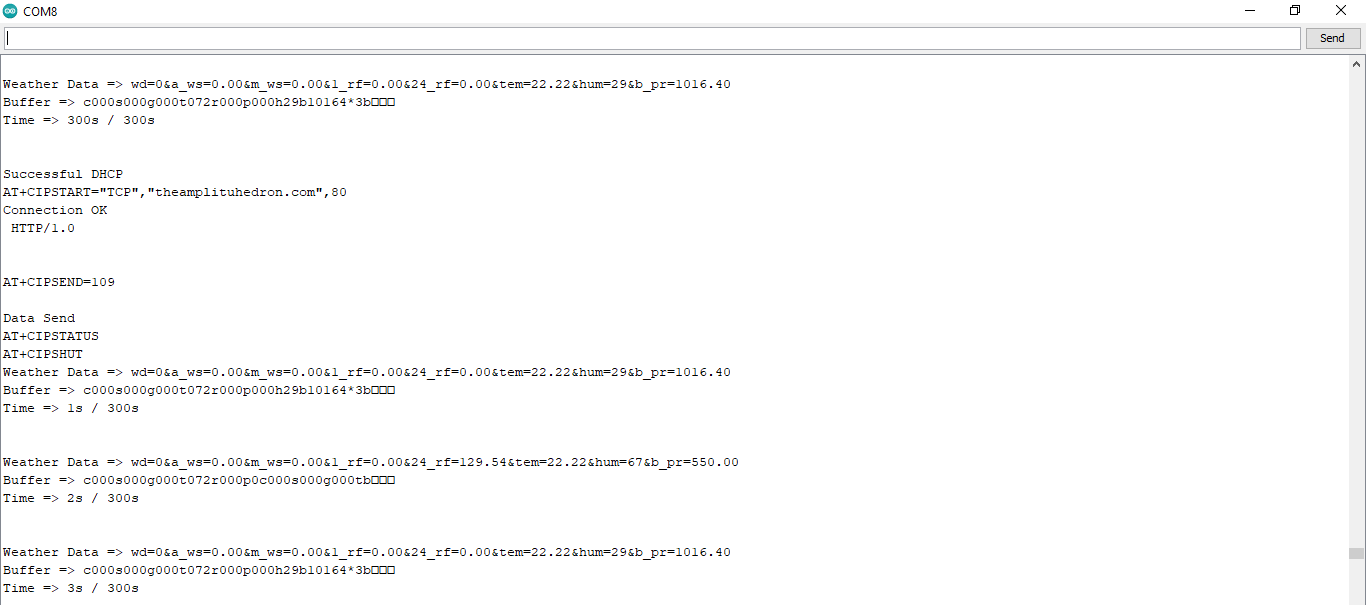
⭐ After uploading the code to the NodeMCU ESP-12E (ESP8266) development board, it displays weather data every second on the serial monitor and sends data packets every five minutes (300 seconds) to the PHP web application.
Connection is successful!

...

Weather Data => wd=0&a_ws=0.00&m_ws=0.00&1_rf=0.00&24_rf=0.00&tem=21.67&hum=29&b_pr=1016.70
Buffer => c000s000g000t071r000p000h29b10167*3
Time => 299s / 300s


Weather Data => wd=0&a_ws=0.00&m_ws=0.00&1_rf=0.00&24_rf=0.00&tem=21.67&hum=29&b_pr=1016.70
Buffer => c000s000g000t071r000p000h29b10167*3
Time => 300s / 300s

...
⭐ Then, it shows the response from the server.
...

Data Send...
HTTP Code => 200
Server Response => Token Found!

8 cells appended.

...
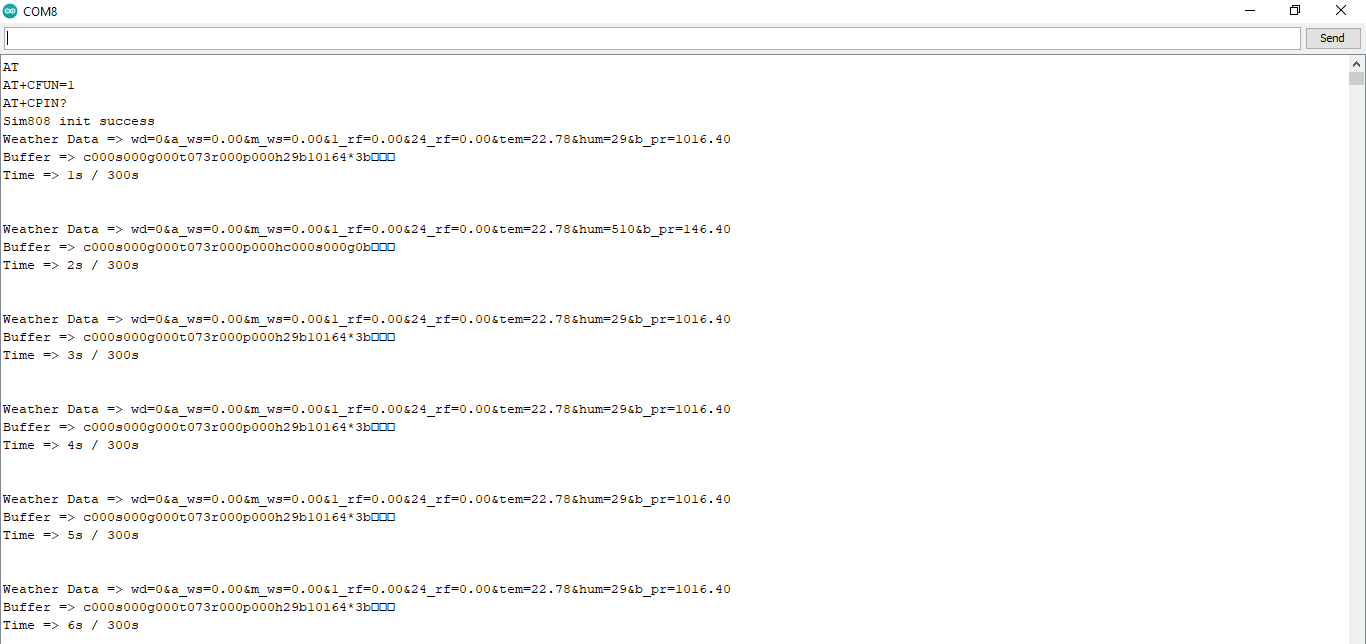
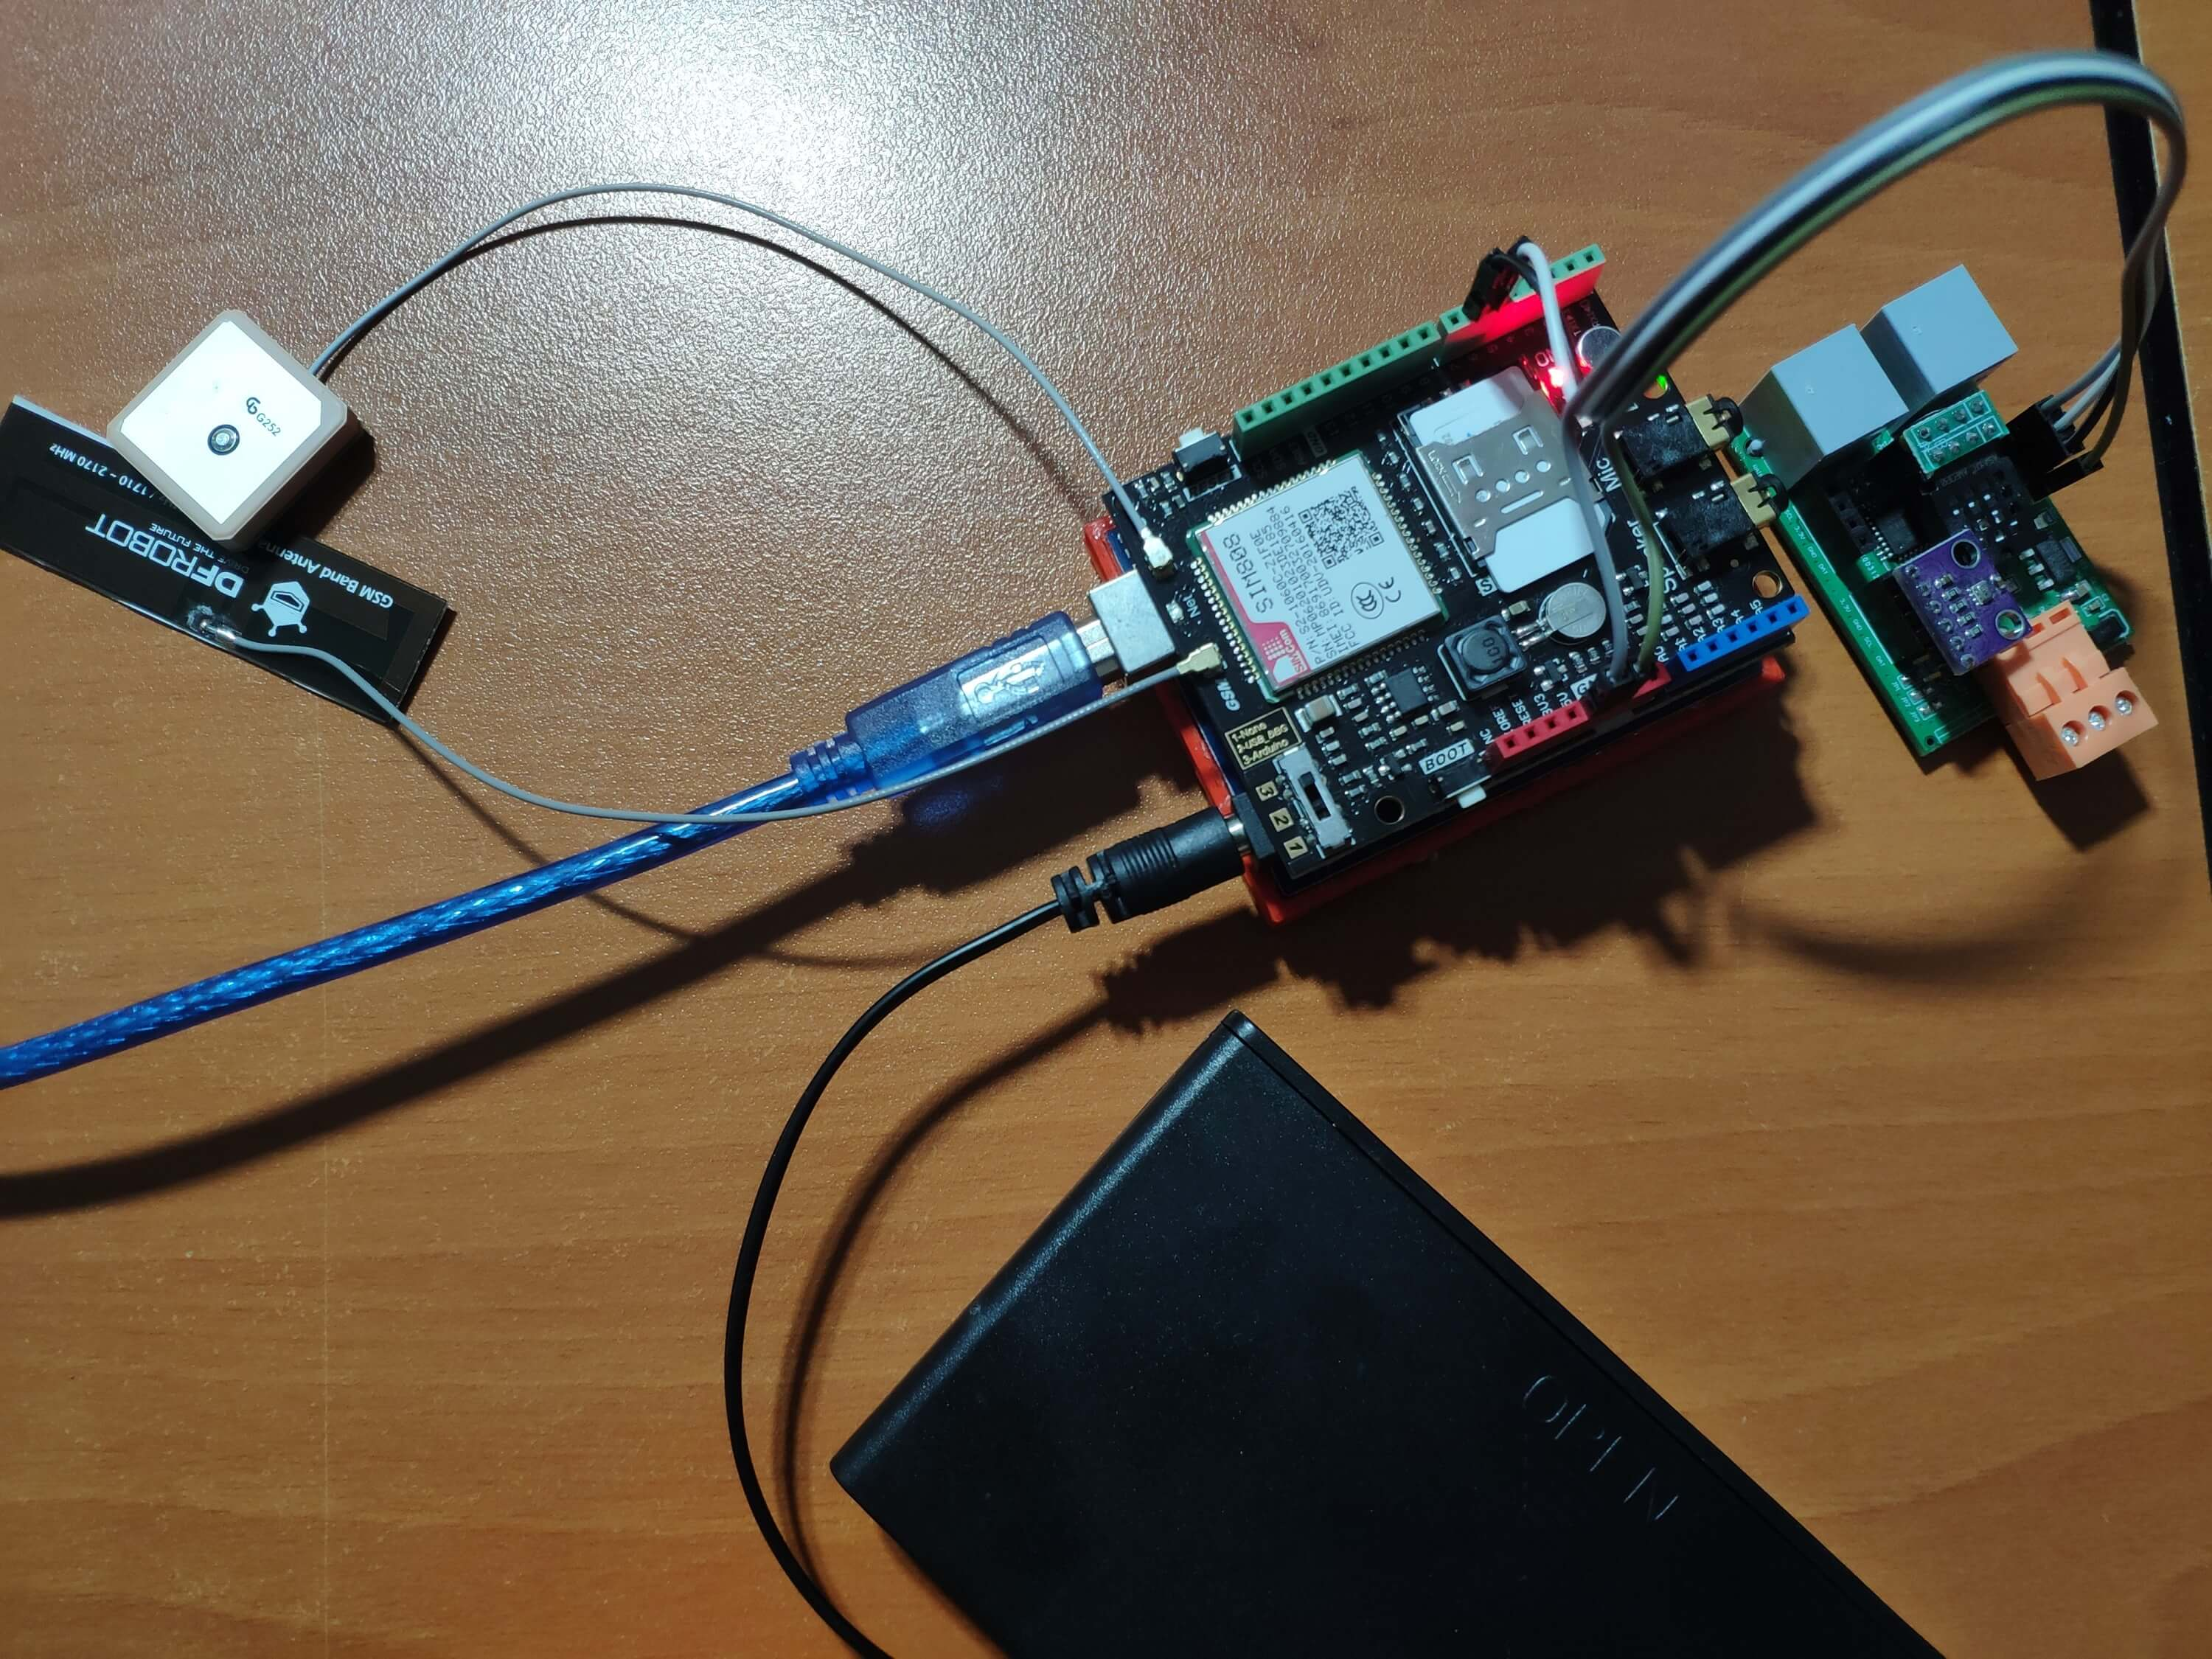
Step 4.1:Reading and sending weather data with SIM808 (GPRS)
To collect weather data in my backyard, I used a SIM808 shield for Arduino Uno if the distance between the weather station and my router is too far away.
Most of the code is the same and covered in the previous step aside from the parts below.
⭐ Include required libraries and define the sim808 object.
For SIM808 GPS/GPRS/GSM Shield | Download
#include
#include

// Define the sim808.
DFRobot_SIM808 sim808(&Serial);
⭐ Initialize the SIM808 module and continue if it is working accurately.
//******** Initialize sim808 module *************
 while(!sim808.init()) {
 delay(1000);
 Serial.print("Sim808 init error\r\n");
 }
 delay(2000);
 // Continue if the SIM808 Module is working accurately.
 Serial.println("Sim808 init success");
 delay(5000);
⭐ Send data packets every 5 minutes to the server by establishing a TCP connection to make a GET request.
transferring++; Serial.println("Time => " + String(transferring) + "s / " + String(int(5*60)) + "s\n\n");
if(transferring ==5*60){
//*********** Attempt DHCP *******************
while(!sim808.join(F("cmnet"))) {
Serial.println("Sim808 join network error!");
delay(2000);
}
//************ Successful DHCP ****************
delay(5000);
Serial.println("Successful DHCP");
//*********** Establish a TCP connection ************
if(!sim808.connect(TCP,"192.168.1.24", 80)) { // Change it with your server.
Serial.println("Connection Error");
}else{
Serial.println("Connection OK");
}
delay(2000);
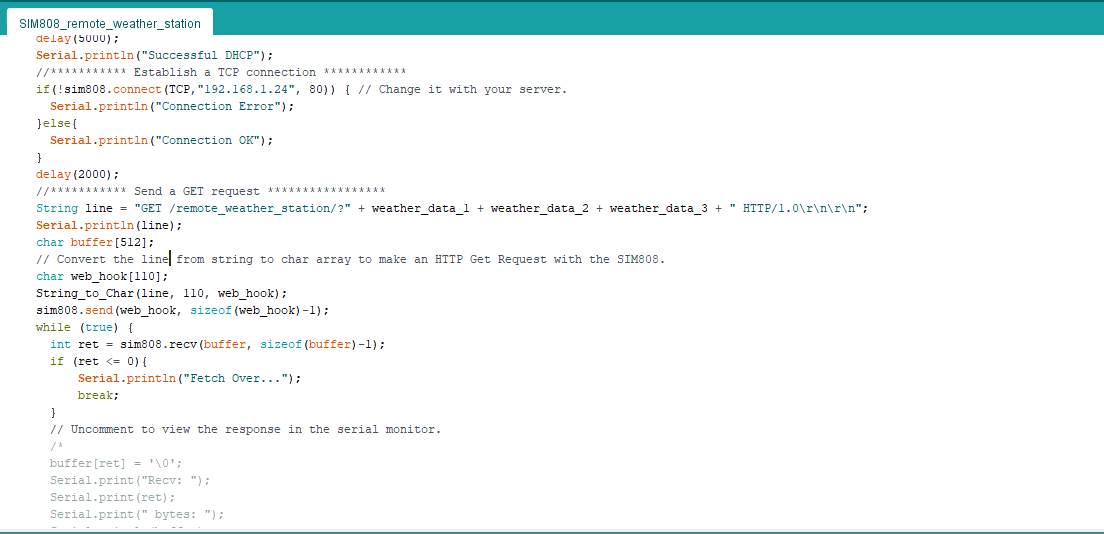
... ⭐ After creating the line string, convert it from string to char array to make an HTTP Get Request with the SIM808.
...

 String line ="GET /remote_weather_station/?" + weather_data_1 + weather_data_2 + weather_data_3 + " HTTP/1.0\r\n\r\n";
 Serial.println(line);
 char buffer[512];
 // Convert the line from string to char array to make an HTTP Get Request with the SIM808.
 char web_hook[110];
 String_to_Char(line, 110, web_hook);
 sim808.send(web_hook, sizeof(web_hook)-1);
 while (true) {
 int ret =sim808.recv(buffer, sizeof(buffer)-1);
 if (ret <=0){
 Serial.println("Fetch Over...");
 break;
 }

 ...
⭐ After uploading the code to the SIM808 shield, it displays weather data every second on the serial monitor and sends data packets every five minutes (300 seconds) to the PHP web application.
Step 4.2:Creating the weather data set for more than three months
After finishing coding, I started to collate weather data on Google Sheets every five minutes for more than three months to build a neural network model and make predictions on the rainfall intensity.
Collected Weather Data:
- Wind Direction (deg)
- Average Wind Speed (m/s)
- Max Wind Speed (m/s)
- One-Hour Rainfall (mm)
- 24-Hours Rainfall (mm)
- Temperature (°C)
- Humidity (%)
- Barometric Pressure (hPa)
Then, I downloaded the spreadsheet as Remote Weather Station.csv , consisting of 32219 rows as my preliminary local weather data set. I am still collating weather data to improve my data set and model :)
Step 5:Building an Artificial Neural Network (ANN) with TensorFlow
When I completed collating my preliminary local weather data set, I started to work on my artificial neural network (ANN) model to make predictions on the rainfall intensity.
I decided to create my neural network model with TensorFlow in Python. So, first of all, I followed the steps below to grasp a better understanding of the weather data:
- Data Visualization
- Data Scaling (Normalizing)
- Data Preprocessing
- Data Splitting
After applying these steps, I decided to use my neural network model to classify different rainfall intensity classes theoretically assigned as labels (outputs) for each input (row). I created my classes according to the rate of precipitation, which depends on the considered time.
The following categories are used to classify rainfall intensity by the rate of precipitation (rainfall):
- Light rain — when the precipitation rate is <2.5 mm per hour
- Moderate rain — when the precipitation rate is between 2.5 mm and 7.6 mm per hour
- Heavy rain — when the precipitation rate is between 7.6 mm and 50 mm per hour
- Violent rain — when the precipitation rate is> 50 mm per hour
According to the precipitation (rainfall) rates, I preprocessed the weather data to assign one of these five classes for each input as its label:
- 0 (None)
- 1 (Light Rain)
- 2 (Moderate Rain)
- 3 (Heavy Rain)
- 4 (Violent Rain)
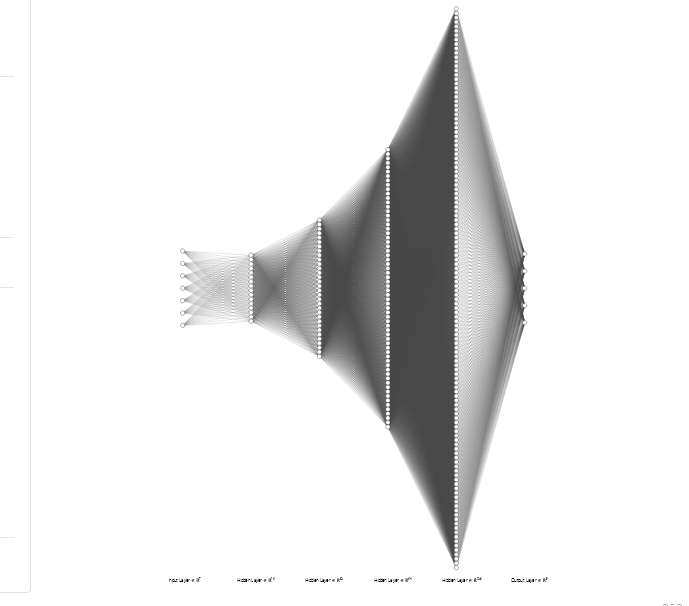
After scaling (normalizing) and preprocessing the weather data, I elicited seven input variables and one label for each reading, classified with the five mentioned classes. Then, I built an artificial neural network model with TensorFlow to obtain the best possible results and predictions with my preliminary data set.
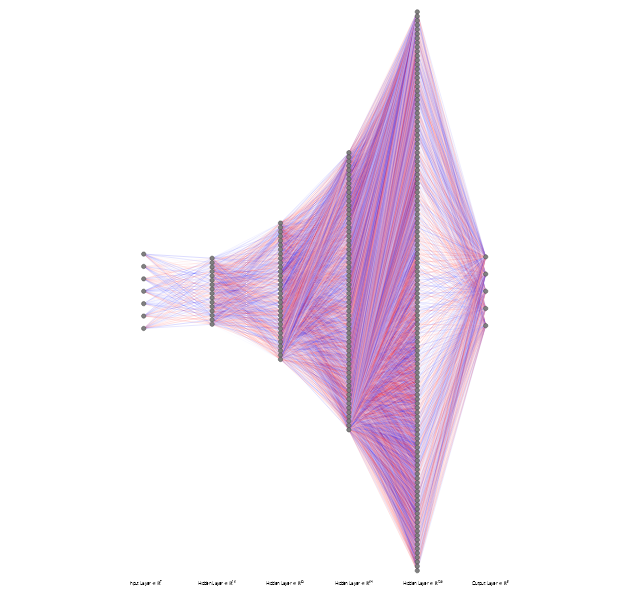
Layers:
- 7 [Input]
- 16 [Hidden]
- 32 [Hidden]
- 64 [Hidden]
- 128 [Hidden]
- 5 [Output]
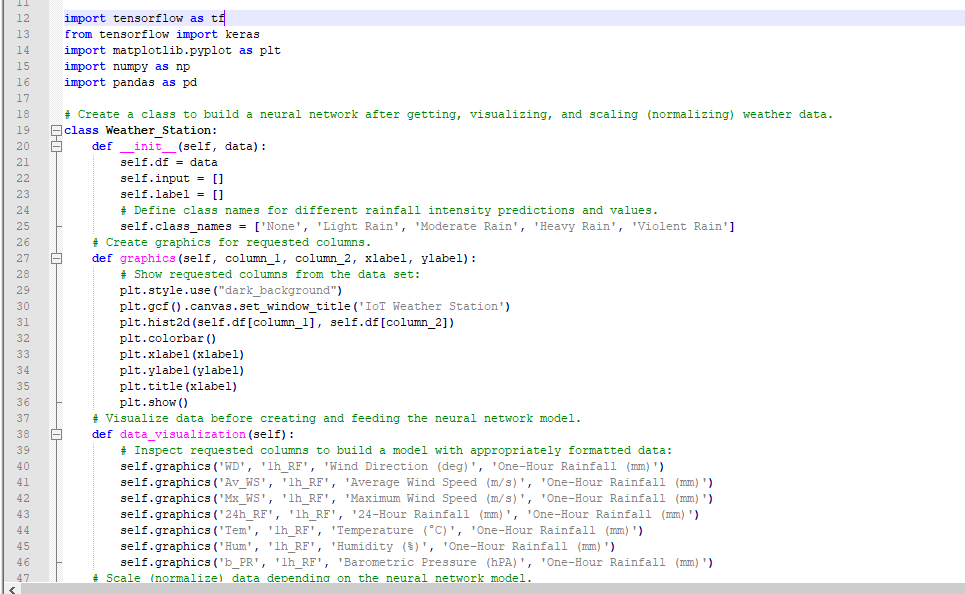
To execute all steps above, I created a class named Weather_Station in Python after including the required libraries:
import tensorflow as tf
from tensorflow import keras
import matplotlib.pyplot as plt
import numpy as np
import pandas as pd
Subsequently, I will discuss coding in Python for each step I mentioned above.
Also, you can download IoT_weather_station_neural_network.py to inspect coding.
Step 5.1:Visualizing and scaling (normalizing) the weather data
Before diving in to build a model, it is important to understand the weather data to pass the model appropriately formatted data.
So, in this step, I will show you how to visualize weather data and scale (normalize) in Python.
⭐ First of all, read the weather data from Remote Weather Station.csv .
csv_path ="E:\PYTHON\Remote Weather Station.csv"
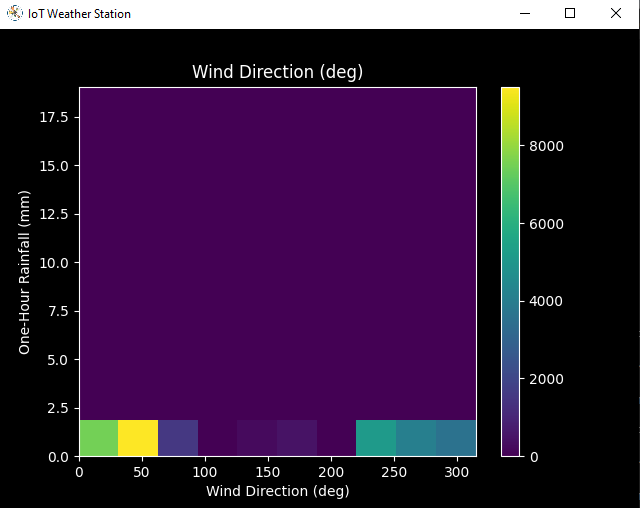
df =pd.read_csv(csv_path) ⭐ In the graphics() function, visualize the requested columns from the weather data set by using the Matplotlib library.
def graphics(self, column_1, column_2, xlabel, ylabel):
 # Show requested columns from the data set:
 plt.style.use("dark_background")
 plt.gcf().canvas.set_window_title('IoT Weather Station')
 plt.hist2d(self.df[column_1], self.df[column_2])
 plt.colorbar()
 plt.xlabel(xlabel)
 plt.ylabel(ylabel)
 plt.title(xlabel)
 plt.show()
⭐ In the data_visualization() function, inspect all columns before scaling weather data to build a model with appropriately formatted data.
def data_visualization(self):
# Inspect requested columns to build a model with appropriately formatted data:
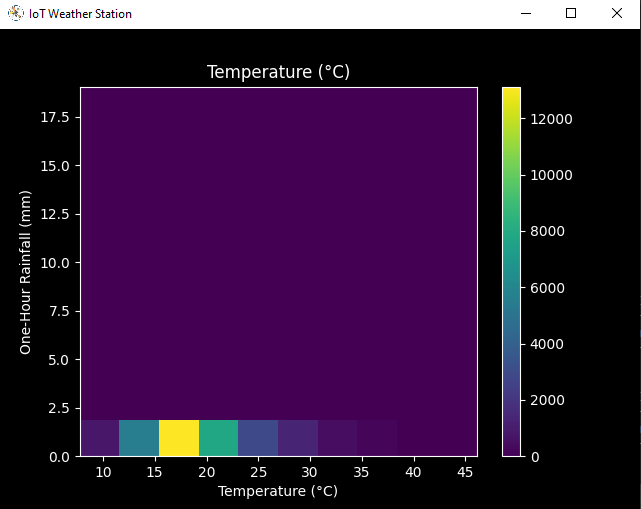
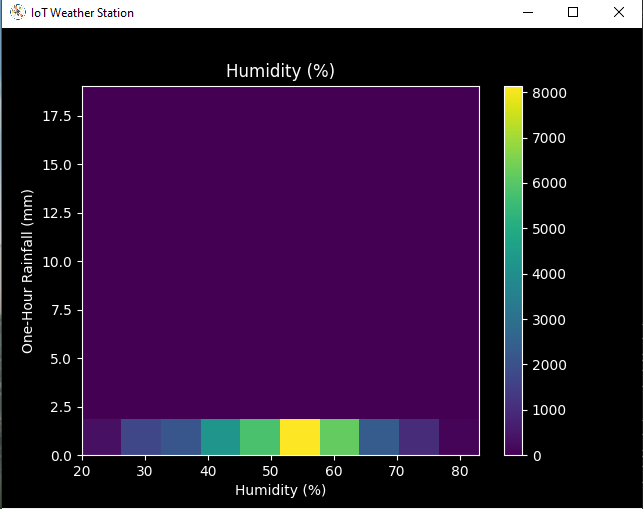
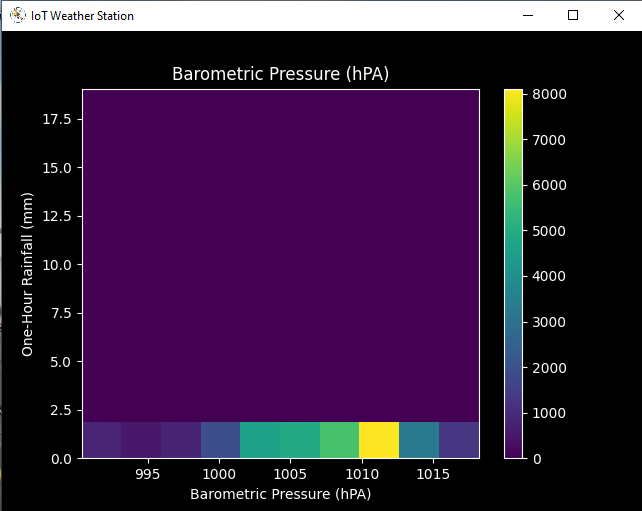
self.graphics('WD', '1h_RF', 'Wind Direction (deg)', 'One-Hour Rainfall (mm)')
self.graphics('Av_WS', '1h_RF', 'Average Wind Speed (m/s)', 'One-Hour Rainfall (mm)')
self.graphics('Mx_WS', '1h_RF', 'Maximum Wind Speed (m/s)', 'One-Hour Rainfall (mm)')
self.graphics('24h_RF', '1h_RF', '24-Hour Rainfall (mm)', 'One-Hour Rainfall (mm)')
self.graphics('Tem', '1h_RF', 'Temperature (°C)', 'One-Hour Rainfall (mm)')
self.graphics('Hum', '1h_RF', 'Humidity (%)', 'One-Hour Rainfall (mm)')
self.graphics('b_PR', '1h_RF', 'Barometric Pressure (hPA)', 'One-Hour Rainfall (mm)')
After visualizing weather data, I scaled (normalized) each column to format it properly.
Normally, each row (reading) looked like this before scaling:
- 315, 0.45, 0, 0.51, 0.51, 22.78, 65, 1005.5
⭐ In the scale_data() function:
⭐ The wind direction in units of degrees and angles do not make good model inputs. 360° and 0° should be close to each other and wrap around smoothly. The direction should not matter if the wind is not blowing. Thus, convert the wind direction and velocity columns to a wind vector to interpret them easily with a neural network model.
def scale_data(self):
 # Wind Direction and Speed:
 wv =self.df.pop('Av_WS')
 max_wv =self.df.pop('Mx_WS')
 # Convert to radians.
 wd_rad =self.df.pop('WD')*np.pi / 180
 # Calculate the wind x and y components.
 self.df['scaled_WX'] =wv*np.cos(wd_rad)
 self.df['scaled_WY'] =wv*np.sin(wd_rad)
 # Calculate the max wind x and y components.
 self.df['scaled_max_WX'] =max_wv*np.cos(wd_rad)
 self.df['scaled_max_WY'] =max_wv*np.sin(wd_rad)

 ...
⭐ For the remaining columns except for 1h_RF , divide them into average reading values to scale (normalize) and format.
...

 # Temperature:
 tem =self.df.pop('Tem')
 self.df['scaled_Tem'] =tem / 25
 # Humidity:
 hum =self.df.pop('Hum')
 self.df['scaled_Hum'] =hum / 70
 # Barometric Pressure:
 bPR =self.df.pop('b_PR')
 self.df["scaled_bPR"] =bPR / 1013
 # 24 Hour Rainfall (Approx.)
 rain_24 =self.df.pop('24h_RF')
 self.df['scaled_24h_RF'] =rain_24 / 24
After completing scaling (normalizing), I extracted these new columns from the weather data set:
- scaled_WX
- scaled_WY
- scaled_max_WX
- scaled_max_WY
- scaled_Tem
- scaled_Hum
- scaled_bPR
- scaled_24h_RF
Step 5.2:Training the model (ANN) on the rainfall intensity classes
Before building and training a neural network model in TensorFlow, I needed to create the input array and the label array by preprocessing the scaled and normalized weather data set.
⭐ In the create_input_and_label() function:
⭐ Firstly, append each input element as a NumPy array to the input array and convert it to a NumPy array by using the asarray() fonction.
⭐ Each input element includes seven variables [shape=(7, )]:
- [scaled_WX, scaled_WY, scaled_max_WX, scaled_max_WY, scaled_Tem, scaled_Hum, scaled_bPR]
def create_input_and_label(self):
 n =len(self.df)
 # Create the input array using the scaled variables:
 for i in range(n):
 self.input.append(np.array([self.df['scaled_WX'][i], self.df['scaled_WY'][i], self.df['scaled_max_WX'][i], self.df['scaled_max_WY'][i], self.df['scaled_Tem'][i], self.df['scaled_Hum'][i], self.df['scaled_bPR'][i]]))
 self.input =np.asarray(self.input)

 ...
⭐ Then, evaluate the approximate rainfall (precipitation) rate for each reading (row).
approx_RF_rate =(1h_RF + scaled_24h_RF) * 100
⭐ According to the rainfall rate, assign a class [0 - 4] for each input element and append them to the label array.
...
for i in range(n):
_class =0
# Evaluate the approximate rainfall rate:
approx_RF_rate =(self.df['1h_RF'][i] + self.df['scaled_24h_RF'][i]) * 100
# As labels, assign classes of rainfall intensity according to the approximate rainfall rate (mm):
if approx_RF_rate ==0:
_class =0
elif approx_RF_rate <2.5:
_class =1
elif 2.5
elif 7.6
else:
_class =4
self.label.append(_class)
self.label =np.asarray(self.label) After preprocessing the scaled weather data to create input and label arrays, I split them as training (60%) and test (40%) data sets:
def split_data(self):
n =len(self.df)
# (60%, 40%) - (training, test)
self.train_input =self.input[0:int(n*0.6)]
self.test_input =self.input[int(n*0.6):]
self.train_label =self.label[0:int(n*0.6)]
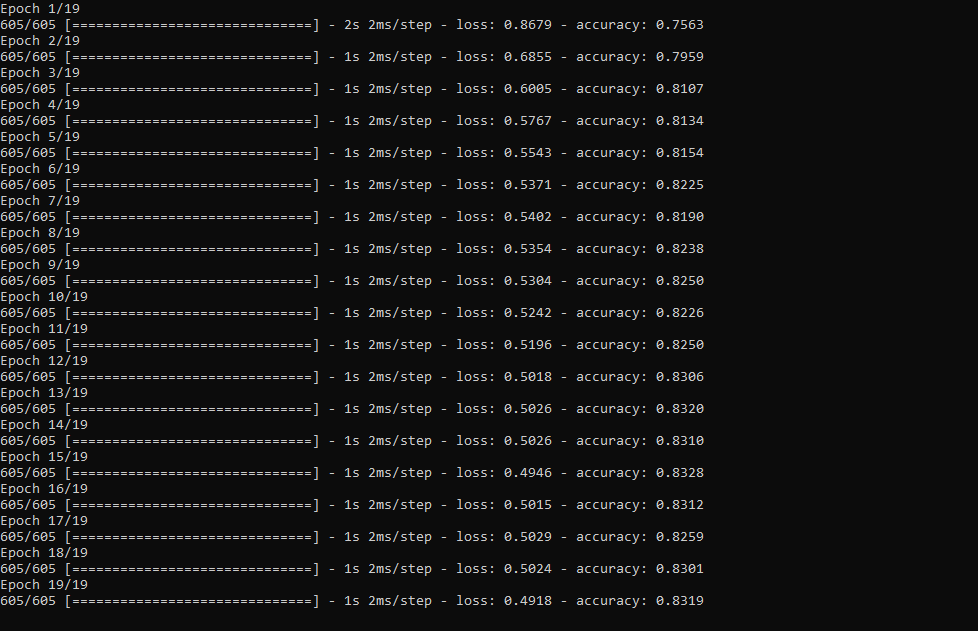
self.test_label =self.label[int(n*0.6):] Then, I built my artificial neural network (ANN) model by using Keras and trained it with the training data set for nineteen epochs.
You can inspect these tutorials to learn about activation functions, loss functions, epochs, etc.
def build_and_train_model(self):
 # Build the neural network:
 self.model =keras.Sequential([
 keras.Input(shape=(7,)),
 keras.layers.Dense(16, activation='relu'),
 keras.layers.Dense(32, activation='relu'),
 keras.layers.Dense(64, activation='relu'),
 keras.layers.Dense(128, activation='relu'),
 keras.layers.Dense(5, activation='softmax')
 ])
 # Compile:
 self.model.compile(optimizer='adam', loss="sparse_categorical_crossentropy", metrics=['accuracy'])
 # Train:
 self.model.fit(self.train_input, self.train_label, epochs=19)

 ...
After training with the preliminary training data set, the accuracy of the model is between 0.83 and 0.85 .
Step 5.3:Evaluating the model and making predictions on the rainfall intensity
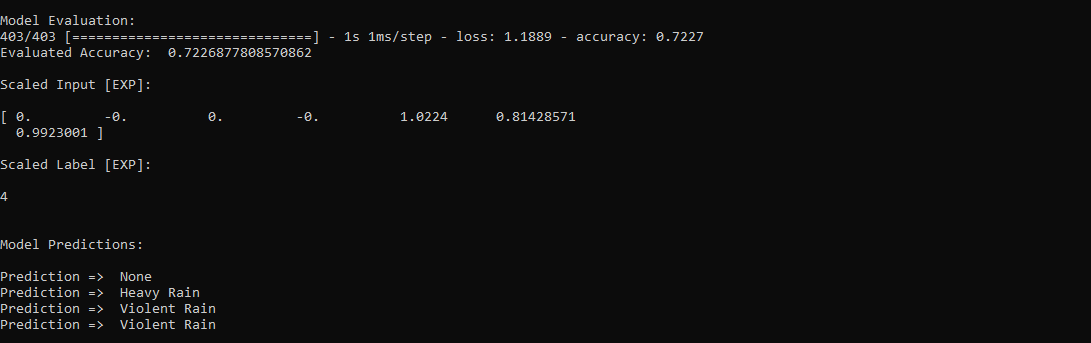
After building and training my artificial neural network model, I tested its accuracy by using the preliminary testing data set.
For now, the evaluated accuracy of the model is between 0.72 and 0.73 due to inadequate testing data set overfitting the model. However, I am still collecting weather data to improve the model accuracy.
...

 # Test the accuracy:
 print("\n\nModel Evaluation:")
 test_loss, test_acc =self.model.evaluate(self.test_input, self.test_label)
 print("Evaluated Accuracy:", test_acc)
Then, I used my neural network model to make predictions on the rainfall intensity with a given prediction array consisting of readings from the weather station after the training of the model. As a starting point, the model works fine :)
The model predicts possibilities of labels for each input element as an array of 5 numbers. They represent the model's "confidence" that the given input element corresponds to each of the five different classes of rainfall intensity [0 - 4].
⭐ In the make_prediction() function, make a prediction for each input element in a given array and get the most accurate label [0 - 4] by using the argmax() function to display its class name.
def make_prediction(self, pre_array):
 print("\n\nModel Predictions:\n")
 prediction =self.model.predict(pre_array)
 for i in range(len(pre_array)):
 print("Prediction => ", self.class_names[np.argmax(prediction[i])])
Prediction Inputs:
- [0, 0, 0.31819805, 0.31819805, 0.6988, 0.81498571, 0.99349753]
- [0, -0, 0, -0, 0.8444, 1, 0.96835143]
- [0, 0, 0.45, 0, 0.87577, 0.95857143, 1.00128332]
- [-0, -0, -0, -0, 0.8224, 1.05714286, 0.99279368]
Prediction Outputs:
- 0 [None]
- 3 [Heavy Rain]
- 4 [Violent Rain]
- 4 [Violent Rain]

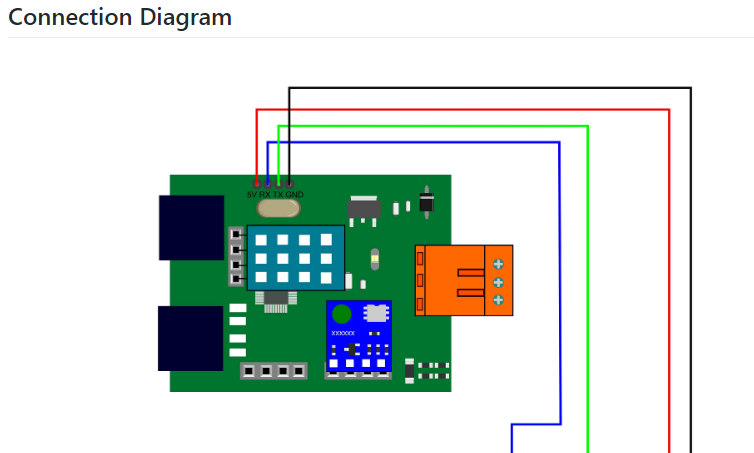
Connections and Adjustments (ESP8266)
// Connections
// NodeMCU ESP-12E (ESP8266) :
// Weather Station
// VV --------------------------- 5V
// D5 --------------------------- RX
// D6 --------------------------- TX
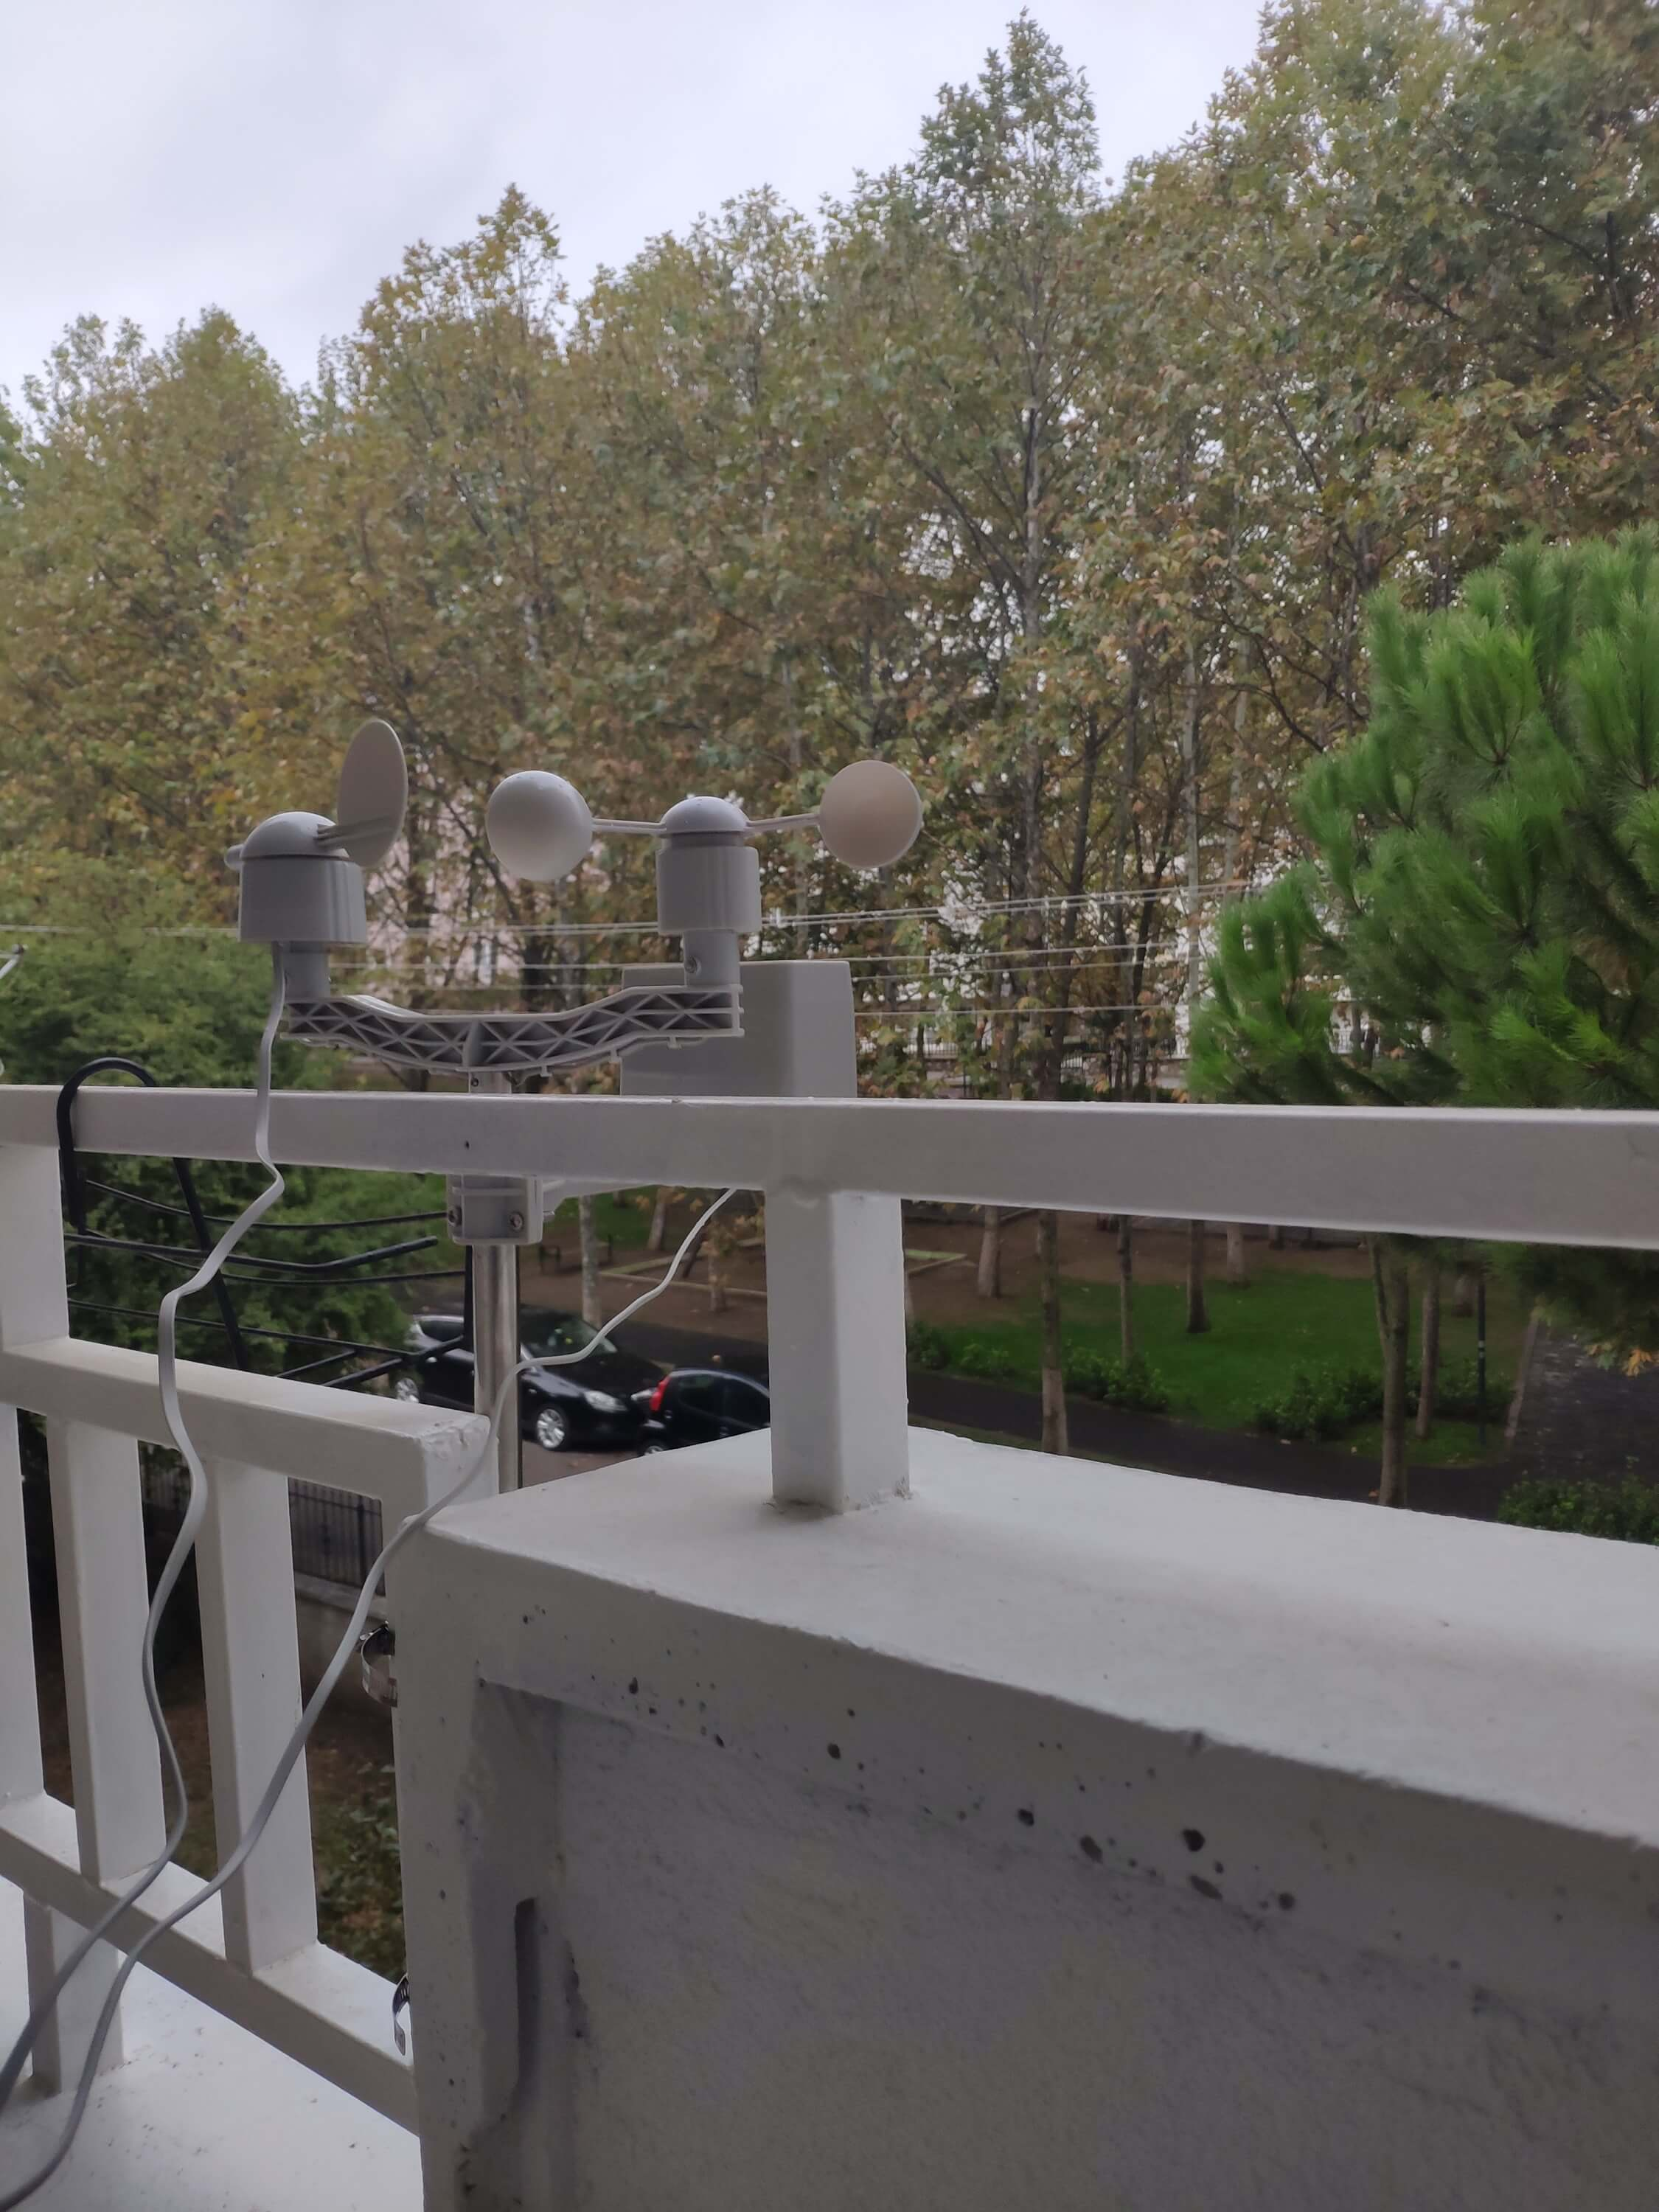
// G --------------------------- GND I connected the sensor (converter) board to the NodeMCU ESP-12E (ESP8266) development board and fastened them to a plastic box while collecting weather data at my balcony.
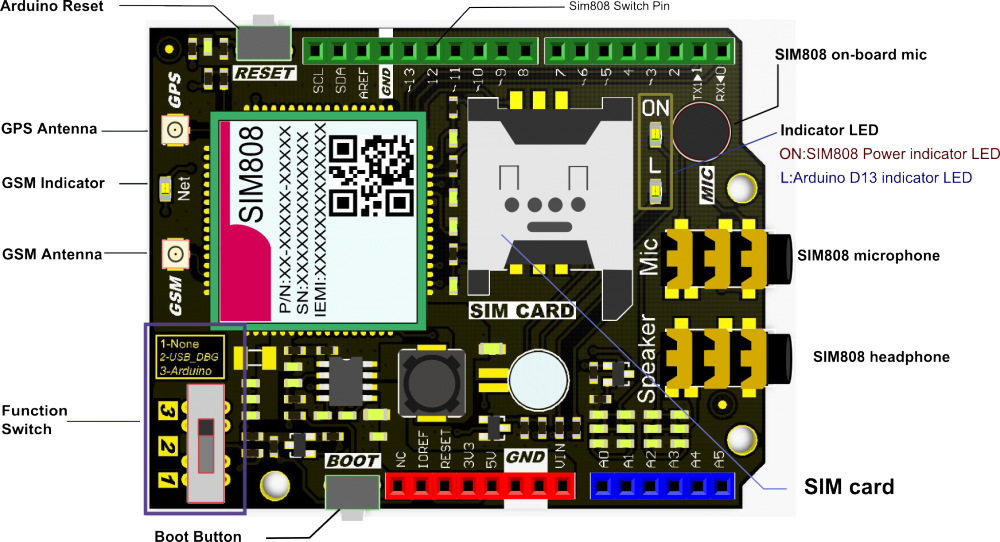
Connections and Adjustments (SIM808)
// Connections
// Arduino Uno:
// SIM808 GPS/GPRS/GSM Shield For Arduino
// D0 --------------------------- RX
// D1 --------------------------- TX
// D12 --------------------------- POWER
// Weather Station
// 5V --------------------------- 5V
// D5 --------------------------- RX
// D6 --------------------------- TX
// GND --------------------------- GND
⭐ Note:D0, D1, D12 pins are occupied by the SIM808 GPS/GPRS/GSM Shield.
⭐ Connect an external battery (7-23V) for the SIM808 module to work properly.
⭐ Attach the GPS antenna and the GSM antenna to the SIM808 shield.
⭐ Insert a SIM card into the SIM slot on the SIM808 shield.
⭐ Before uploading the code, set the function switch on the shield to None (1).
⭐ Upload the code.
⭐ Then, set the function switch to Arduino (3).
⭐ Press the Boot button on the shield until seeing the Net indicator LED flashing every 1 second and wait for the SIM card to register the network - the Net indicator LED will slowly flash every 3 seconds.
⭐ Click here to get more information about the SIM808 GSM/GPS/GPRS Shield.
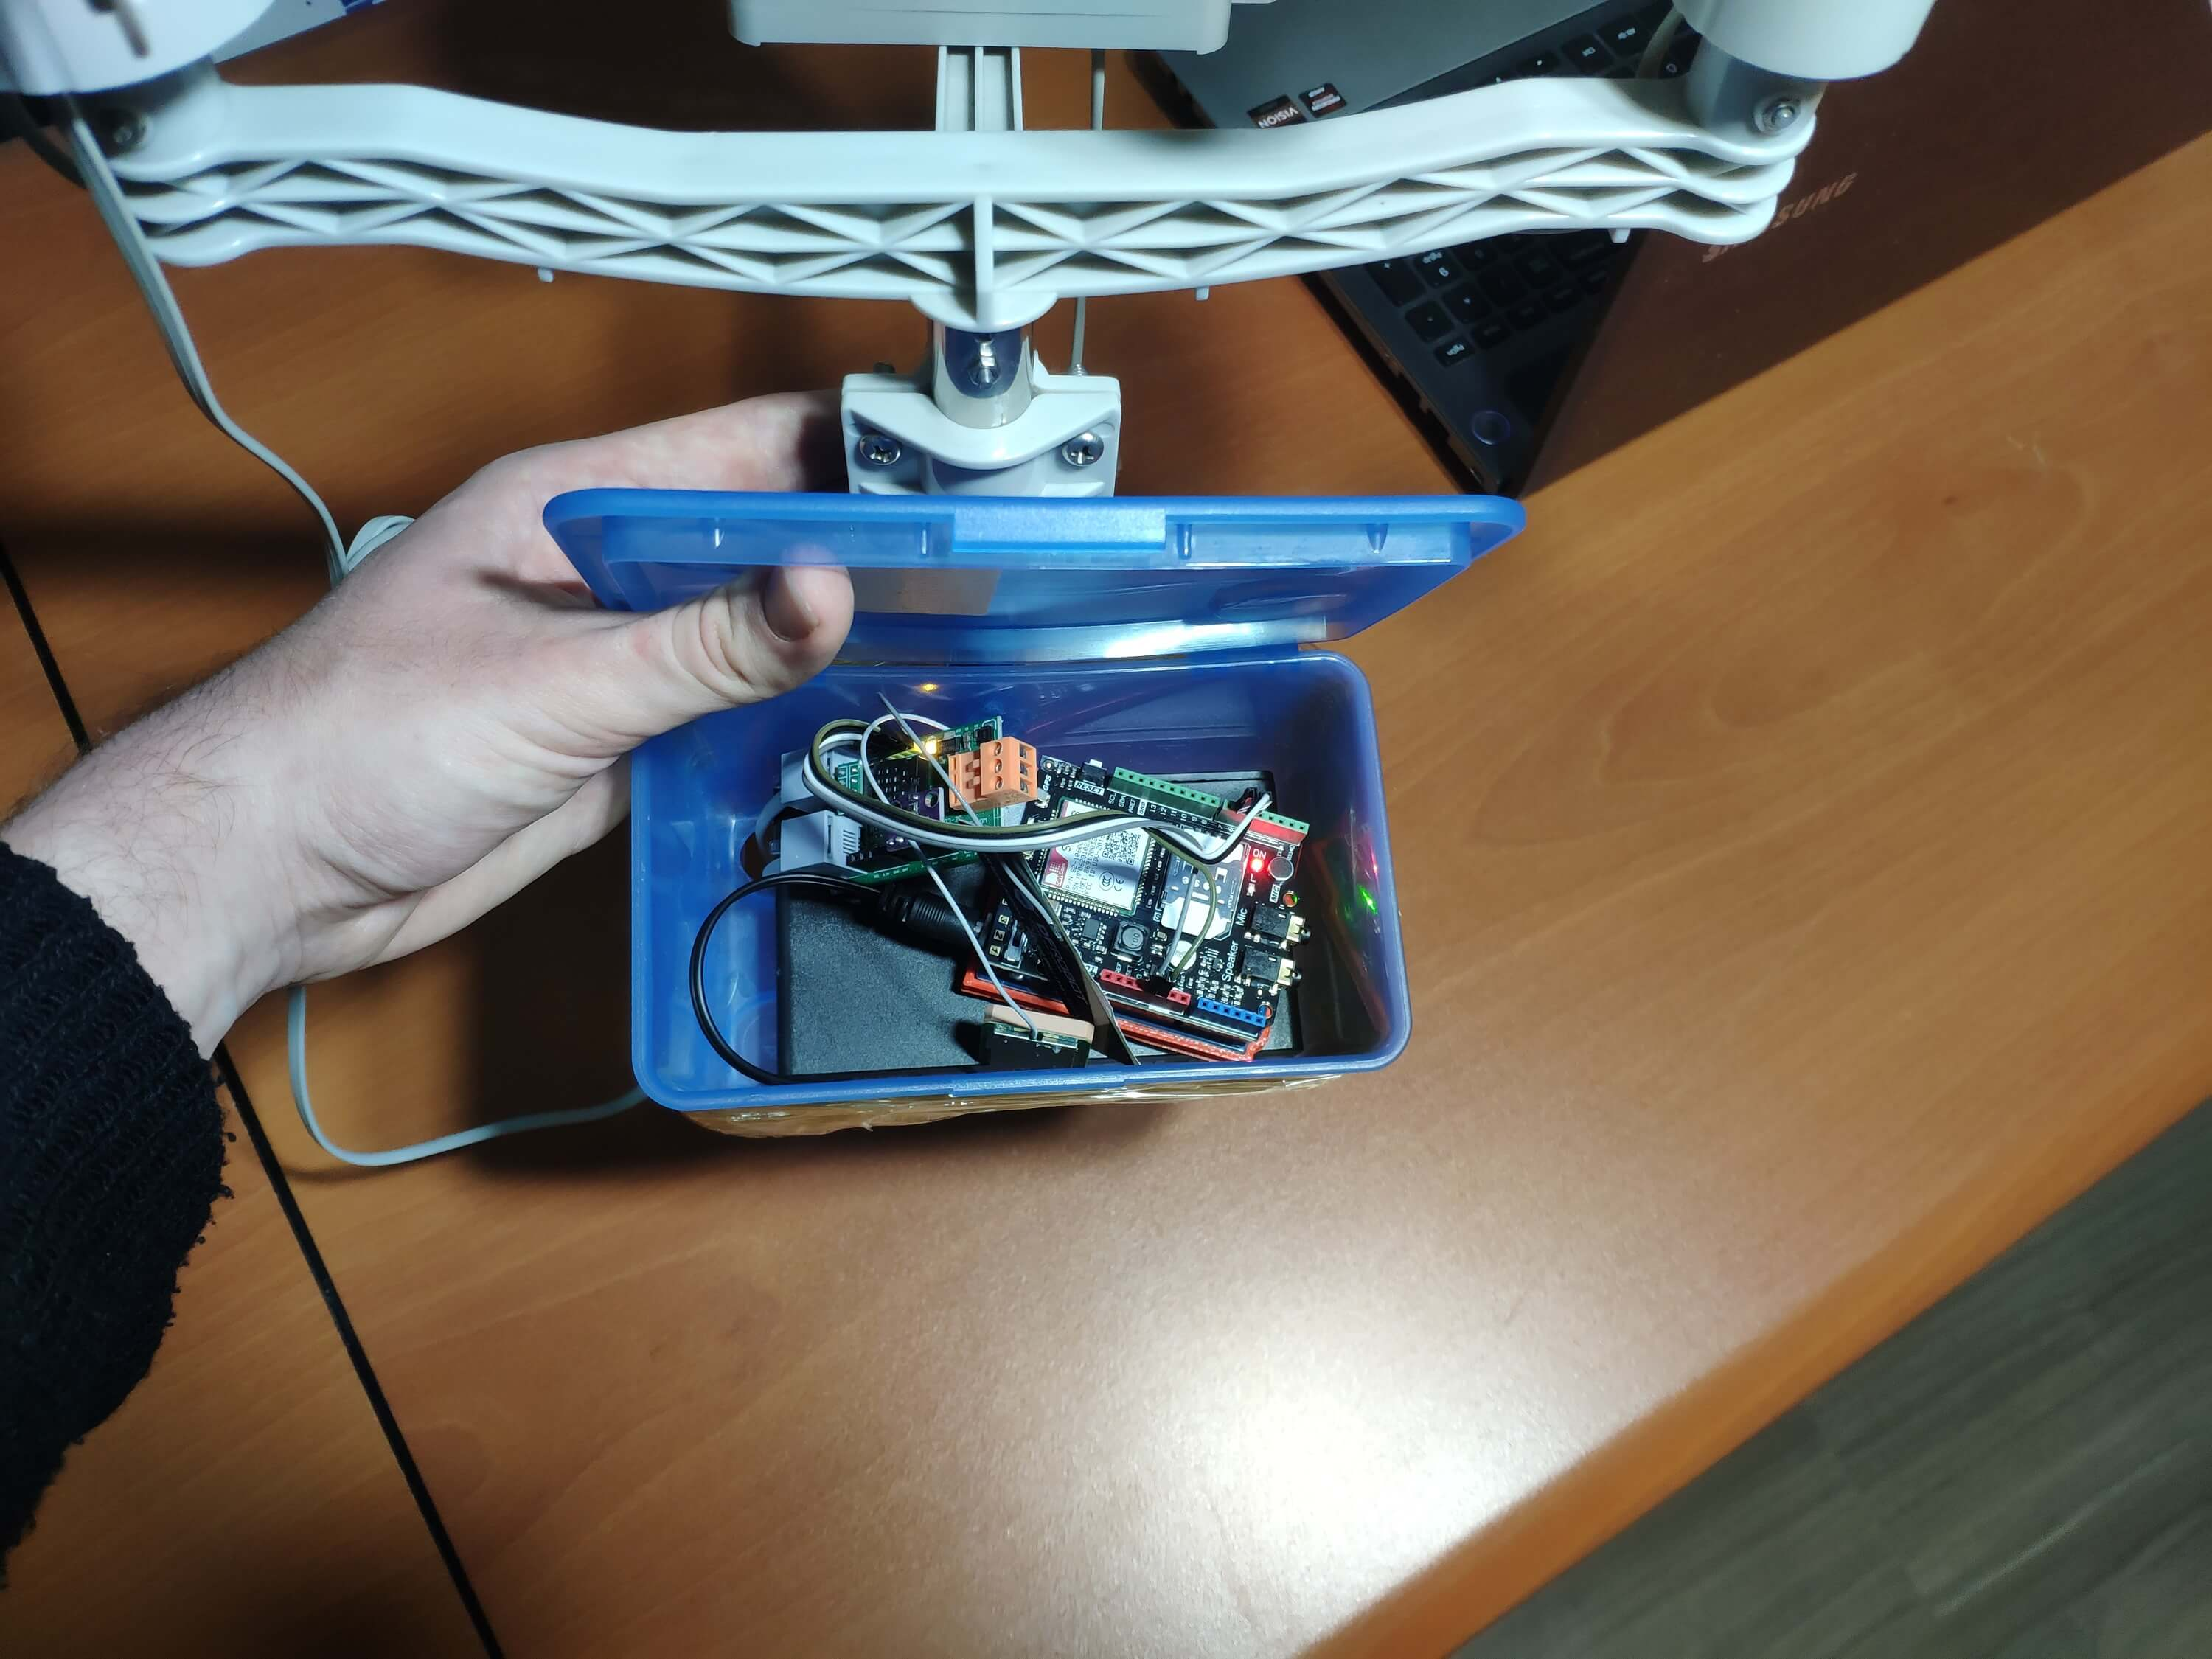
After setting up the SIM808 shield with Arduino Uno, I connected the sensor (converter) board to it.
I placed all components into a plastic box to collect weather data outside, even in extreme weather conditions, since the sensor board is not weather-proof.
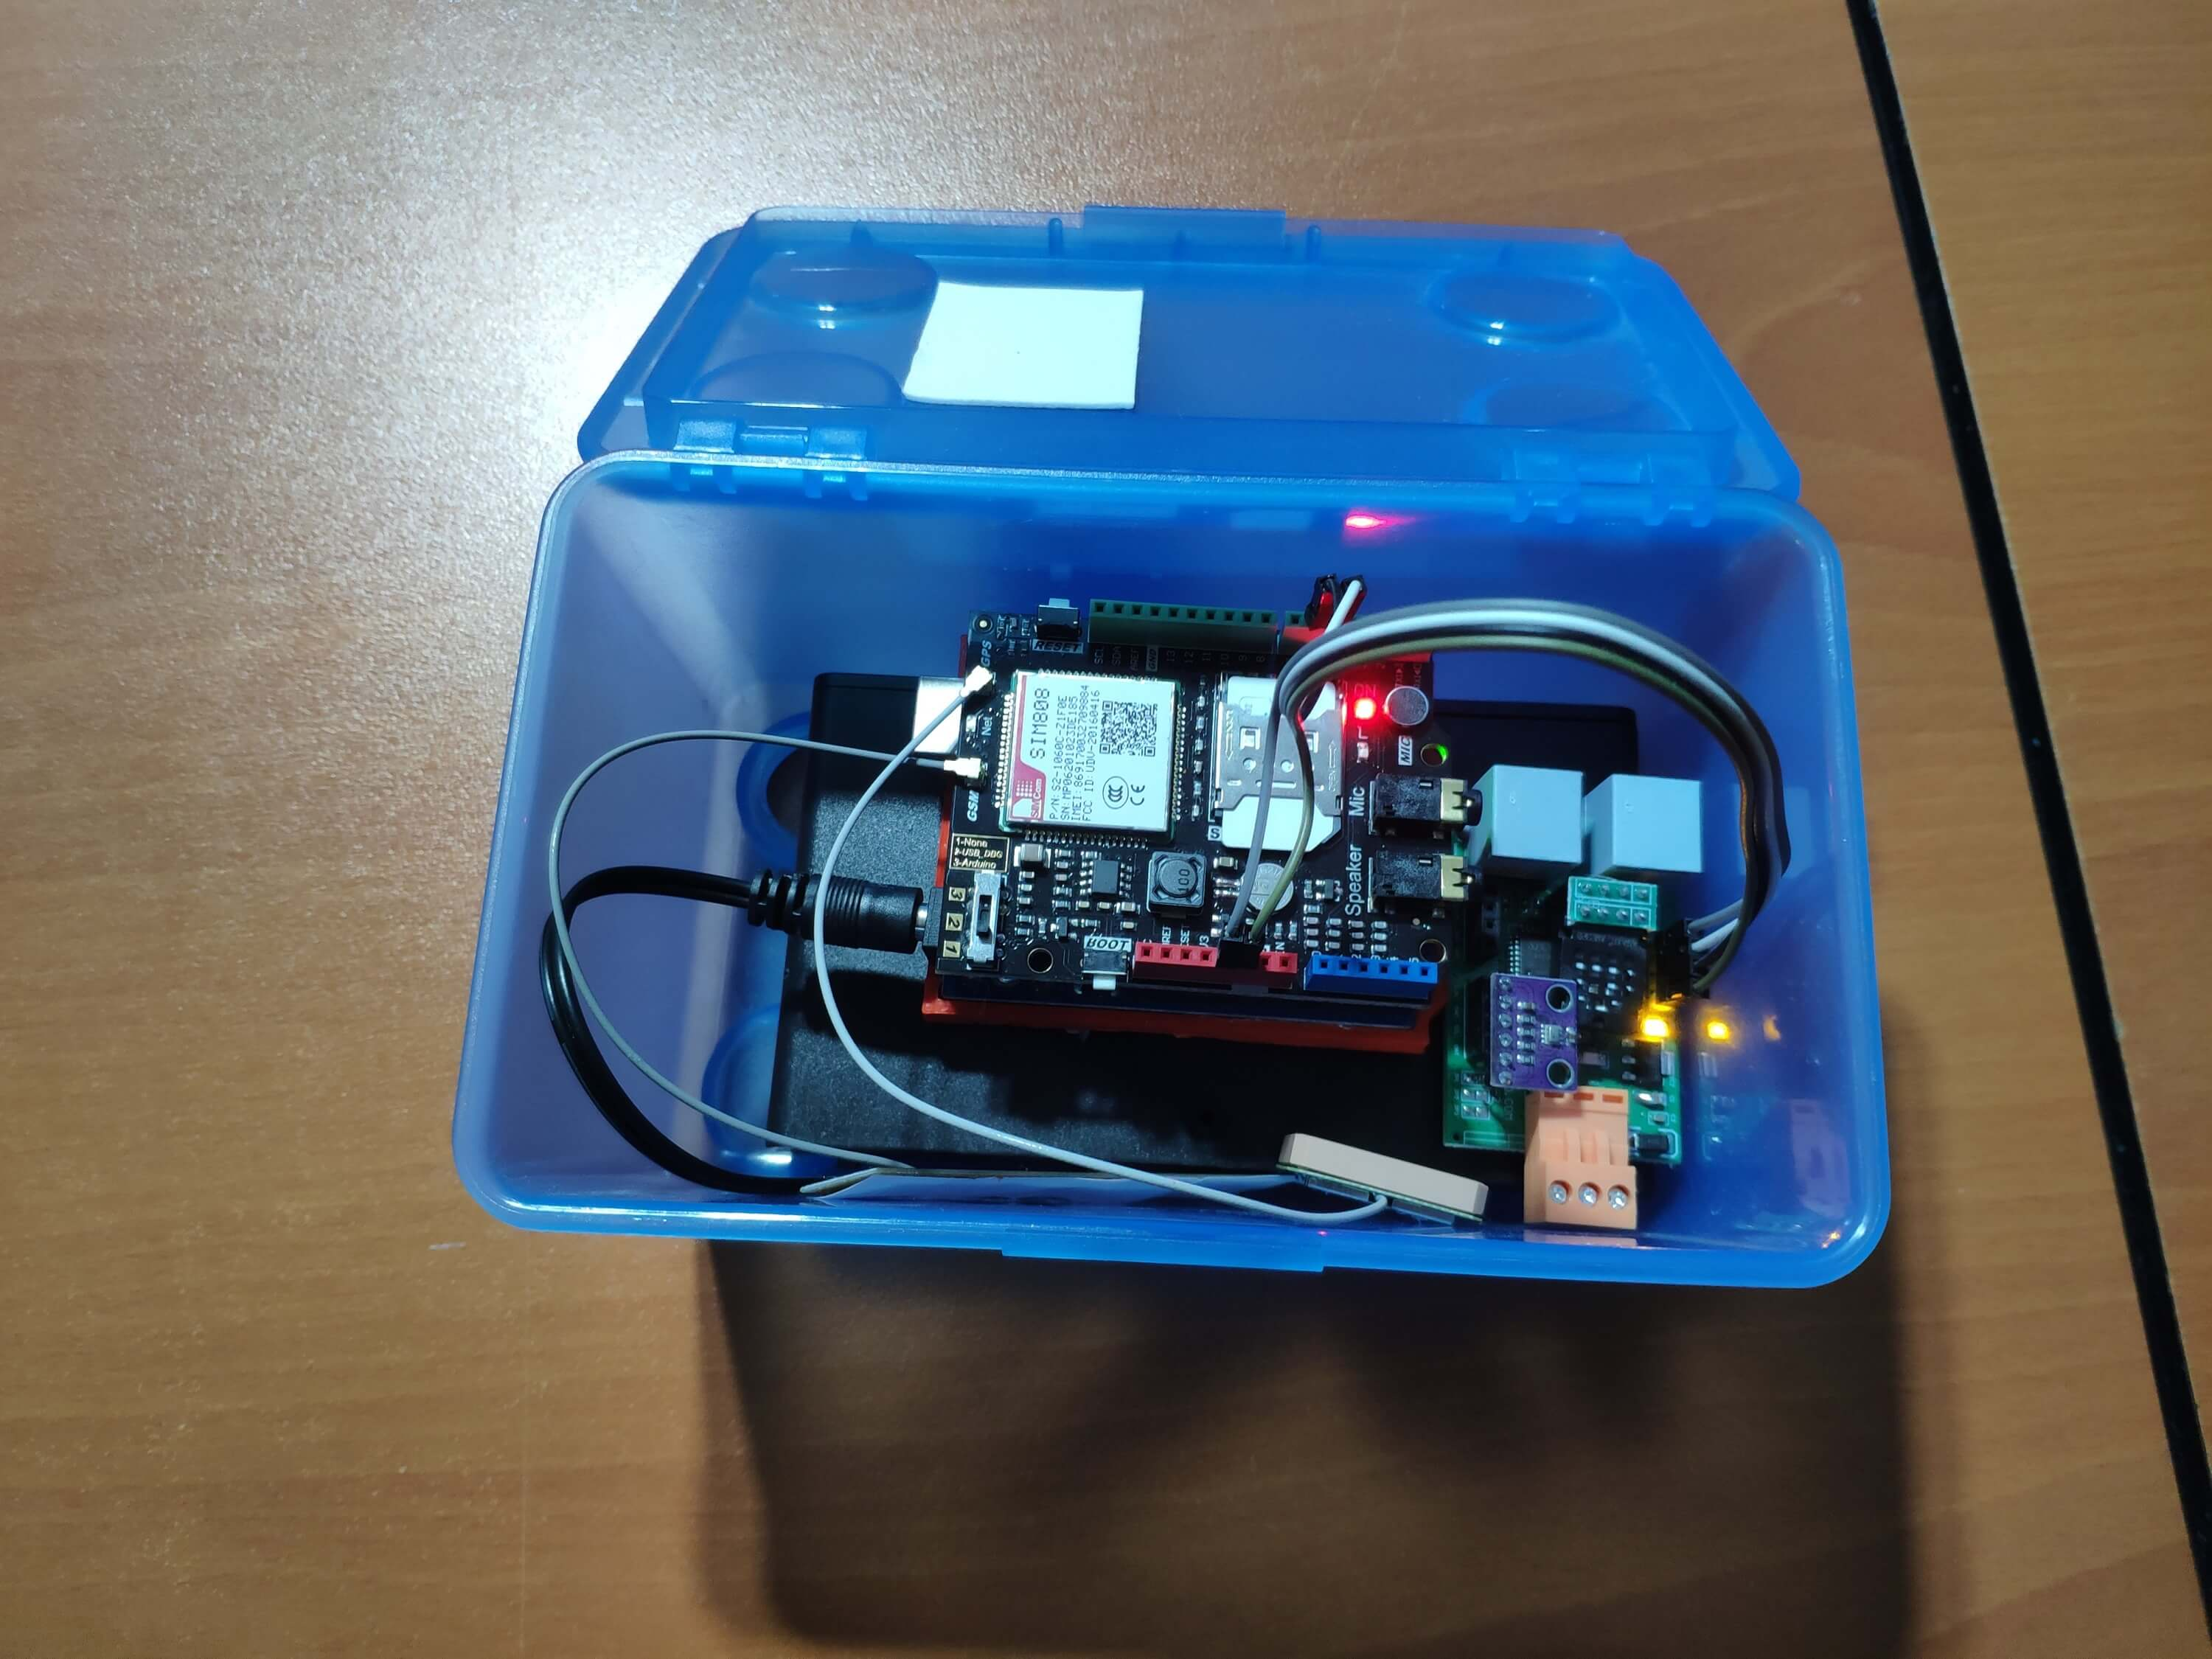
Then, I fastened the plastic box to the weather station.
Videos and Conclusion
After completing coding and assembling the weather station, I collated local weather data for more than three months every five minutes to build my neural network model successfully.
I am still collecting weather data at my balcony and backyard to improve my neural network model and its accuracy :)
Further Discussions
☔ 💧 Since we need local weather data sets to get more accurate predictions on weather phenomena, budget-friendly NN-enabled weather stations like this can be placed on farms and greenhouses to avert the detrimental effects of excessive rainfall on agriculture.
☔ 💧 As early warning systems working with neural networks, we can use them simultaneously to create a swarm of weather stations communicating and feeding each other to forecast rainfall intensity precisely in local areas.
☔ 💧 Also, we can utilize that information for assessing:
- vital water resources,
- agriculture,
- crop productivity,
- ecosystems,
- hydrology.
References
[1] Extreme weather - heavy rainfall , NIWA, https://niwa.co.nz/natural-hazards/extreme-weather-heavy-rainfall
[2] University of Illinois at Urbana-Champaign, News Bureau. "Excessive rainfall as damaging to corn yield as extreme heat, drought. " ScienceDaily. ScienceDaily, 30 April 2019. www.sciencedaily.com/releases/2019/04/190430121744.htm.
[3] Andrew Culclasure, Using Neural Networks to Provide Local Weather Forecasts , Georgia Southern University, Spring 2013, 29https://digitalcommons.georgiasouthern.edu/cgi/viewcontent.cgi?article=1031&context=etd.
Code
- IoT_weather_station_neural_network.py
- ESP12E_remote_weather_station.ino
- SIM808_remote_weather_station.ino
- index.php (web application)
- account_verification_token.php (web application)
IoT_weather_station_neural_network.pyPython
# IoT Weather Station Predicting Rainfall Intensity w/ TensorFlow# Windows, Linux, or Ubuntu# By Kutluhan Aktar# Collates weather data on Google Sheets and interprets it with a neural network built in TensorFlow to make predictions on the rainfall intensity. # For more information:# https://www.theamplituhedron.com/projects/IoT_Weather_Station_Predicting_Rainfall_Intensity_with_TensorFlowimport tensorflow as tffrom tensorflow import kerasimport matplotlib.pyplot as pltimport numpy as npimport pandas as pd# Create a class to build a neural network after getting, visualizing, and scaling (normalizing) weather data.class Weather_Station:def __init__(self, data):self.df =data self.input =[] self.label =[] # Define class names for different rainfall intensity predictions and values. self.class_names =['None', 'Light Rain', 'Moderate Rain', 'Heavy Rain', 'Violent Rain'] # Create graphics for requested columns. def graphics(self, column_1, column_2, xlabel, ylabel):# Show requested columns from the data set:plt.style.use("dark_background") plt.gcf().canvas.set_window_title('IoT Weather Station') plt.hist2d(self.df[column_1], self.df[column_2]) plt.colorbar() plt.xlabel(xlabel) plt.ylabel(ylabel) plt.title(xlabel) plt.show() # Visualize data before creating and feeding the neural network model. def data_visualization(self):# Inspect requested columns to build a model with appropriately formatted data:self.graphics('WD', '1h_RF', 'Wind Direction (deg)', 'One-Hour Rainfall (mm)') self.graphics('Av_WS', '1h_RF', 'Average Wind Speed (m/s)', 'One-Hour Rainfall (mm)') self.graphics('Mx_WS', '1h_RF', 'Maximum Wind Speed (m/s)', 'One-Hour Rainfall (mm)') self.graphics('24h_RF', '1h_RF', '24-Hour Rainfall (mm)', 'One-Hour Rainfall (mm)') self.graphics('Tem', '1h_RF', 'Temperature (C)', 'One-Hour Rainfall (mm)') self.graphics('Hum', '1h_RF', 'Humidity (%)', 'One-Hour Rainfall (mm)') self.graphics('b_PR', '1h_RF', 'Barometric Pressure (hPA)', 'One-Hour Rainfall (mm)') # Scale (normalize) data depending on the neural network model. def scale_data(self):# Wind Direction and Speed:wv =self.df.pop('Av_WS') max_wv =self.df.pop('Mx_WS') # Convert to radians. wd_rad =self.df.pop('WD')*np.pi / 180 # Calculate the wind x and y components. self.df['scaled_WX'] =wv*np.cos(wd_rad) self.df['scaled_WY'] =wv*np.sin(wd_rad) # Calculate the max wind x and y components. self.df['scaled_max_WX'] =max_wv*np.cos(wd_rad) self.df['scaled_max_WY'] =max_wv*np.sin(wd_rad) # Temperature:tem =self.df.pop('Tem') self.df['scaled_Tem'] =tem / 25 # Humidity:hum =self.df.pop('Hum') self.df['scaled_Hum'] =hum / 70 # Barometric Pressure:bPR =self.df.pop('b_PR') self.df["scaled_bPR"] =bPR / 1013 # 24 Hour Rainfall (Approx.) rain_24 =self.df.pop('24h_RF') self.df['scaled_24h_RF'] =rain_24 / 24 # Define the input and label arrays. def create_input_and_label(self):n =len(self.df) # Create the input array using the scaled variables:for i in range(n):self.input.append(np.array([self.df['scaled_WX'][i], self.df['scaled_WY'][i], self.df['scaled_max_WX'][i], self.df['scaled_max_WY'][i], self.df['scaled_Tem'][i], self.df['scaled_Hum'][i], self.df['scaled_bPR'][i]])) self.input =np.asarray(self.input) # Create the label array using the one-hour and 24-hour rainfall variables:for i in range(n):_class =0 # Evaluate the approximate rainfall rate:approx_RF_rate =(self.df['1h_RF'][i] + self.df['scaled_24h_RF'][i]) * 100 # As labels, assign classes of rainfall intensity according to the approximate rainfall rate (mm):if approx_RF_rate ==0:_class =0 elif approx_RF_rate <2.5:_class =1 elif 2.5 ", self.class_names[np.argmax(prediction[i])]) # Save the model for further usage without training steps:def save_model(self):self.model.save("E:\PYTHON\weather_station.h5") # Run Artificial Neural Network (ANN):def Neural_Network(self, save):self.scale_data() self.create_input_and_label() self.split_data() self.build_and_train_model() if save ==True:self.save_model() # Example Input and Layer:print("\nScaled Input [EXP]:\n") print(self.train_input[0]) print("\nScaled Label [EXP]:\n") print(self.train_label[0]) # Read data (Remote Weather Station.csv):csv_path ="E:\PYTHON\Remote Weather Station.csv"df =pd.read_csv(csv_path)# Define a new class object named 'station':station =Weather_Station(df)# Visualize data:#station.data_visualization()# Artificial Neural Network (ANN):station.Neural_Network(False)# Enter inputs for making predictions:prediction_array =np.array([ [0, 0, 0.31819805, 0.31819805, 0.6988, 0.81498571, 0.99349753], [0, -0, 0, -0, 0.8444, 1, 0.96835143], [0, 0, 0.45, 0, 0.87577, 0.95857143, 1.00128332], [-0, -0, -0, -0, 0.8224, 1.05714286, 0.99279368]])# Prediction Results:station.make_prediction(prediction_array) ESP12E_remote_weather_station.inoArduino
///////////////////////////////////////////// // IoT Weather Station Predicting // // Rainfall Intensity w/ TensorFlow // // ------------------------ // // NodeMCU (ESP-12E) // // by Kutluhan Aktar // // // ///////////////////////////////////////////////// Collates weather data on Google Sheets and interprets it with a neural network built in TensorFlow to make predictions on the rainfall intensity. //// For more information:// https://www.theamplituhedron.com/projects/IoT_Weather_Station_Predicting_Rainfall_Intensity_with_TensorFlow//// Connections// NodeMCU (ESP-12E) :// Weather Station// VV --------------------------- 5V// D5 --------------------------- RX// D6 --------------------------- TX// G --------------------------- GND// Include required libraries:#include#include #include #include #include // Define your WiFi settings.const char *ssid =" ";const char *password =" ";// Define weather station settings:char databuffer[35];double temp;int transferring =0;// Define the serial connection pins - RX and TX.SoftwareSerial Serial_1(D6, D5); // (Rx, Tx)void setup() { // Wait until connected. retard(1000); // Initiate serial ports:Serial.begin(115200); Serial_1.begin(9600); // It is just for assuring if connection is alive. WiFi.mode(WIFI_OFF); retard(1000); // This mode allows NodeMCU to connect any WiFi directly. WiFi.mode(WIFI_STA); // Connect NodeMCU to your WiFi. WiFi.begin(ssid, password); Serial.print("\n\n"); Serial.print("Try to connect to WiFi. Please wait! "); Serial.print("\n\n"); // Halt the code until connected to WiFi. while (WiFi.status() !=WL_CONNECTED) { delay(500); Serial.print("*"); } // If connection is successful:Serial.print("\n\n"); Serial.print("-------------------------------------"); Serial.print("\n\n"); Serial.print("Connection is successful!"); Serial.print("\n\n"); Serial.print("Connected WiFi SSID :"); Serial.print(ssid); Serial.print("\n\n"); Serial.println("Connected IPAddress :"); Serial.println(WiFi.localIP()); Serial.print("\n\n");}void loop() { // Get data from the remote weather station:getBuffer(); // Debug the information and create the link:String weather_data ="wd=" + String(WindDirection()) + "&a_ws=" + String(WindSpeedAverage()) + "&m_ws=" + String(WindSpeedMax()) + "&1_rf=" + String(RainfallOneHour()) + "&24_rf=" + String(RainfallOneDay()) + "&tem=" + String(Temperature()) + "&hum=" + String(Humidity()) + "&b_pr=" + String(BarPressure()); String server ="http://192.168.1.24/remote_weather_station/?"; Serial.println("Weather Data => " + weather_data); Serial.println("Buffer => " + String(databuffer)); // Send data packets every 5 minutes to Raspberry Pi (or any server). transferring++; Serial.println("Time => " + String(transferring) + "s / " + String(int(5*60)) + "s\n\n"); if(transferring ==5*60){ // Create the HTTP object to make a request to the server. HTTPClient http; http.begin(server + weather_data); int httpCode =http.GET(); String payload =http.getString(); Serial.println("Data Send...\nHTTP Code => " + String(httpCode) + "\nServer Response => " + payload + "\n\n"); http.end(); transferring =0; } // Wait 1 second... delay(1000);}// WEATHER STATIONvoid getBuffer(){ int index; for (index =0;index <35;index ++){ if(Serial_1.available()){ databuffer[index] =Serial_1.read(); if (databuffer[0] !='c'){ index =-1; } } else{ index --; } }}int transCharToInt(char *_buffer, int _start, int _stop){ int _index; int result =0; int num =_stop - _start + 1; int _temp[num]; for (_index =_start;_index <=_stop;_index ++){ _temp[_index - _start] =_buffer[_index] - '0'; result =10*result + _temp[_index - _start]; } return result;}int WindDirection(){ return transCharToInt(databuffer,1,3); } // Wind Direction (deg)float WindSpeedAverage(){ temp =0.44704 * transCharToInt(databuffer,5,7); return temp; } // Average Air Speed (1 minute)float WindSpeedMax(){ temp =0.44704 * transCharToInt(databuffer,9,11); return temp; } //Max Air Speed (5 minutes)float Temperature(){ temp =(transCharToInt(databuffer,13,15) - 32.00) * 5.00 / 9.00; return temp; } // Temperature ("C")float RainfallOneHour(){ temp =transCharToInt(databuffer,17,19) * 25.40 * 0.01; return temp; } // Rainfall (1 hour)float RainfallOneDay(){ temp =transCharToInt(databuffer,21,23) * 25.40 * 0.01; return temp; } // Rainfall (24 hours)int Humidity(){ return transCharToInt(databuffer,25,26); } // Humidity (%)float BarPressure(){ temp =transCharToInt(databuffer,28,32); return temp / 10.00; } // Barometric Pressure (hPA)
SIM808_remote_weather_station.inoArduino
///////////////////////////////////////////// // IoT Weather Station Predicting // // Rainfall Intensity w/ TensorFlow // // ------------------------ // // Arduino Uno (SIM808) // // by Kutluhan Aktar // // // ///////////////////////////////////////////////// Collates weather data on Google Sheets and interprets it with a neural network built in TensorFlow to make predictions on the rainfall intensity. //// For more information:// https://www.theamplituhedron.com/projects/IoT_Weather_Station_Predicting_Rainfall_Intensity_with_TensorFlow//// Connections// Arduino Uno:// SIM808 GPS/GPRS/GSM Shield For Arduino// D0 --------------------------- RX// D1 --------------------------- TX// D12 --------------------------- POWER // Weather Station// 5V --------------------------- 5V// D5 --------------------------- RX// D6 --------------------------- TX// GND --------------------------- GND// Include required libraries:#include#include // Define the sim808.DFRobot_SIM808 sim808(&Serial);// Define weather station settings:char databuffer[35];double temp;int transferring =0;// Define the serial connection pins - RX and TX.SoftwareSerial Serial_1(6, 5); // (Rx, Tx)void setup() { // Wait until connected. retard(1000); // Initiate serial ports:Serial.begin(9600); Serial_1.begin(9600); //******** Initialize sim808 module ************* while(!sim808.init()) { delay(1000); Serial.print("Sim808 init error\r\n"); } delay(2000); // Continue if the SIM808 Module is working accurately. Serial.println("Sim808 init success"); delay(5000);}void loop() { // Get data from the remote weather station:getBuffer(); // Debug the information and create the link:String weather_data_1 ="wd=" + String(WindDirection()) + "&a_ws=" + String(WindSpeedAverage()) + "&m_ws=" + String(WindSpeedMax()); String weather_data_2 ="&1_rf=" + String(RainfallOneHour()) + "&24_rf=" + String(RainfallOneDay()) + "&tem=" + String(Temperature()); String weather_data_3 ="&hum=" + String(Humidity()) + "&b_pr=" + String(BarPressure()); Serial.print("Weather Data => " + weather_data_1); Serial.print(weather_data_2); Serial.println(weather_data_3); Serial.println("Buffer => " + String(databuffer)); // Send data packets every 5 minutes to the server. transferring++; Serial.println("Time => " + String(transferring) + "s / " + String(int(5*60)) + "s\n\n"); if(transferring ==5*60){ //*********** Attempt DHCP ******************* while(!sim808.join(F("cmnet"))) { Serial.println("Sim808 join network error!"); retard (2000); } //************ Successful DHCP **************** delay(5000); Serial.println("Successful DHCP"); //*********** Establish a TCP connection ************ if(!sim808.connect(TCP,"192.168.1.24", 80)) { // Change it with your server. Serial.println("Connection Error"); }else{ Serial.println("Connection OK"); } delay(2000); //*********** Send a GET request ***************** String line ="GET /remote_weather_station/?" + weather_data_1 + weather_data_2 + weather_data_3 + " HTTP/1.0\r\n\r\n"; Serial.println(ligne); char buffer[512]; // Convert the line from string to char array to make an HTTP Get Request with the SIM808. char web_hook[110]; String_to_Char(line, 110, web_hook); sim808.send(web_hook, sizeof(web_hook)-1); while (true) { int ret =sim808.recv(buffer, sizeof(buffer)-1); if (ret <=0){ Serial.println("Fetch Over..."); Pause; } // Uncomment to view the response in the serial monitor. /* buffer[ret] ='\0'; Serial.print("Recv:"); Serial.print(ret); Serial.print(" bytes:"); Serial.println(buffer); */ Serial.println("\nData Send"); Pause; } //************* Close TCP or UDP connections ********** sim808.close(); //*** Disconnect wireless connection, Close Moving Scene ******* sim808.disconnect(); // Exit. transferring =0; } // Wait 1 second... delay(1000);}// WEATHER STATIONvoid getBuffer(){ int index; for (index =0;index <35;index ++){ if(Serial_1.available()){ databuffer[index] =Serial_1.read(); if (databuffer[0] !='c'){ index =-1; } } else{ index --; } }}int transCharToInt(char *_buffer, int _start, int _stop){ int _index; int result =0; int num =_stop - _start + 1; int _temp[num]; for (_index =_start;_index <=_stop;_index ++){ _temp[_index - _start] =_buffer[_index] - '0'; result =10*result + _temp[_index - _start]; } return result;}int WindDirection(){ return transCharToInt(databuffer,1,3); } // Wind Direction (deg)float WindSpeedAverage(){ temp =0.44704 * transCharToInt(databuffer,5,7); return temp; } // Average Air Speed (1 minute)float WindSpeedMax(){ temp =0.44704 * transCharToInt(databuffer,9,11); return temp; } //Max Air Speed (5 minutes)float Temperature(){ temp =(transCharToInt(databuffer,13,15) - 32.00) * 5.00 / 9.00; return temp; } // Temperature ("C")float RainfallOneHour(){ temp =transCharToInt(databuffer,17,19) * 25.40 * 0.01; return temp; } // Rainfall (1 hour)float RainfallOneDay(){ temp =transCharToInt(databuffer,21,23) * 25.40 * 0.01; return temp; } // Rainfall (24 hours)int Humidity(){ return transCharToInt(databuffer,25,26); } // Humidity (%)float BarPressure(){ temp =transCharToInt(databuffer,28,32); return temp / 10.00; } // Barometric Pressure (hPA)void String_to_Char(String _String, int _size, char _convert[]){ for(int i=0;i<_size;i++){ _convert[i] =_String[i]; }}
index.php (web application)PHP
 (int)$_GET['wd'], "a_ws" => (float)$_GET['a_ws'], "m_ws" => (float)$_GET['m_ws'], "1_rf" => (float)$_GET['1_rf'], "24_rf" => (float)$_GET['24_rf'], "tem" => (float)$_GET['tem'], "hum" => (int)$_GET['hum'], "b_pr" => (float)$_GET['b_pr'] ];}else{ $variables_from_module =[ "wd" => "err", "a_ws" => "err", "m_ws" => "err", "1_rf" => "err", "24_rf" => "err", "tem" => "err", "hum" => "err", "b_pr" => "err" ];}/** * Returns an authorized API client. * @return Google_Client the authorized client object */function getClient(){ $client =new Google_Client(); $client->setApplicationName('Remote Weather Station'); // Enter your application name. $client->setScopes('https://www.googleapis.com/auth/spreadsheets'); $client->setAuthConfig('credentials.json'); $client->setAccessType('offline'); $client->setPrompt('select_account consent'); // Load previously authorized token from a file, if it exists. // The file token.json stores the user's access and refresh tokens, and is // created automatically when the authorization flow completes for the first // time. $tokenPath ='token.json'; if (file_exists($tokenPath)) { $accessToken =json_decode(file_get_contents($tokenPath), true); $client->setAccessToken($accessToken); print("Token Found!"); } // If there is no previous token or it's expired. if ($client->isAccessTokenExpired()) { // Refresh the token if possible, else fetch a new one. if ($client->getRefreshToken()) { $client->fetchAccessTokenWithRefreshToken($client->getRefreshToken()); } else { // Request authorization from the user. $authUrl =$client->createAuthUrl(); // Do not forget to refresh the page after getting the verification code and entering it to the account_verification_token.php. printf("Open the following link in your browser:

%s

", $authUrl); // <=Comment print 'Do not forget to refresh the page after getting the verification code and entering it to the account_verification_token.php.

Set the verification code in the account_verification_token.php file.'; // <=Comment // Set the verification code to create the token.json. $authCode =trim($GLOBALS['account_verification_token']); // Exchange authorization code for an access token. $accessToken =$client->fetchAccessTokenWithAuthCode($authCode); $client->setAccessToken($accessToken); // Check to see if there was an error and the account_verification_token is entered. if (array_key_exists('error', $accessToken)) { throw new Exception(join(', ', $accessToken)); }else{ print("Successful! Refresh the page."); } } // Save the token to a file. if (!file_exists(dirname($tokenPath))) { mkdir(dirname($tokenPath), 0700, true); } file_put_contents($tokenPath, json_encode($client->getAccessToken())); } return $client;}// Get the API client and construct the service object.$client =getClient();$service =new Google_Service_Sheets($client);// Enter your spreadsheetId:$spreadsheetId ='';// Enter the range (the first row) under which new values will be appended (8 rows):$range ='A1:H1';// Append recent findings from the weather station to the spreadsheet.$values =[ [$variables_from_module["wd"], $variables_from_module["a_ws"], $variables_from_module["m_ws"], $variables_from_module["1_rf"], $variables_from_module["24_rf"], $variables_from_module["tem"], $variables_from_module["hum"], $variables_from_module["b_pr"]]];$body =new Google_Service_Sheets_ValueRange([ 'values' => $values]);$params =[ 'valueInputOption' => "RAW"];// Append if only requested!if(isset($_GET['wd']) &&isset($_GET['a_ws']) &&isset($_GET['m_ws']) &&isset($_GET['1_rf']) &&isset($_GET['24_rf']) &&isset($_GET['tem']) &&isset($_GET['hum']) &&isset($_GET['b_pr'])){ $result =$service->spreadsheets_values->append($spreadsheetId, $range, $body, $params); printf("

%d cells appended.", $result->getUpdates()->getUpdatedCells());}else{ print ("
Missing Data!");}
account_verification_token.php (web application)PHP
"; // Enter the verification code after authorization. ?>
Pièces et boîtiers personnalisés
remote_weather_station_OobOCQNPSW.csvSchémas
Processus de fabrication
- Station météo basée sur Raspberry Pi
- Station météo Raspberry Pi 2
- Station météo Raspberry Pi
- Projet IoT 101 :Diffuser la température de votre Raspberry Pi
- Surveillance à distance de la météo à l'aide de Raspberry Pi
- Rejoignez l'IOT avec votre station météo – CWOP
- Java ME 8 + Raspberry Pi + Sensors =IoT World (Part 1)
- Raspberry PI Based IoT Project Connecting DHT11 Sensor
- Windows 10 IoT Core sur Raspberry Pi 2 – Données du capteur Adafruit